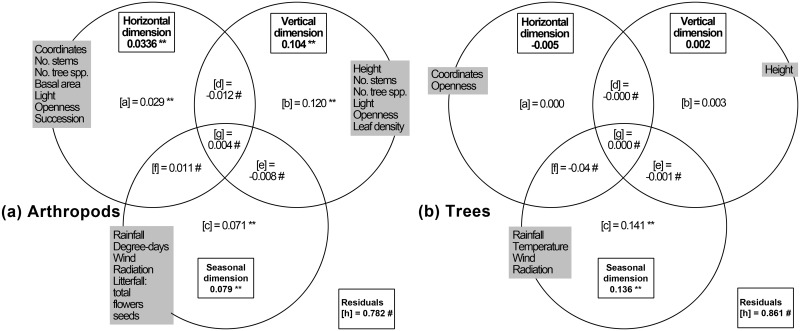
Fig 5. Venn diagrams summarizing canonical variation partitioning along three dimensions for (a) arthropods and (b) flowering trees.
(a) 5858 arthropod species collected at 12 sites with all collecting methods. (b) 25 species of trees flowering during Surveys 1–4. Variables used to characterize the three dimensions are included in grey boxes. ** = significance of the fraction of variation (200 randomizations, p< 0.01); # fraction not testable. For description of fractions [a]-[h], see methods.

