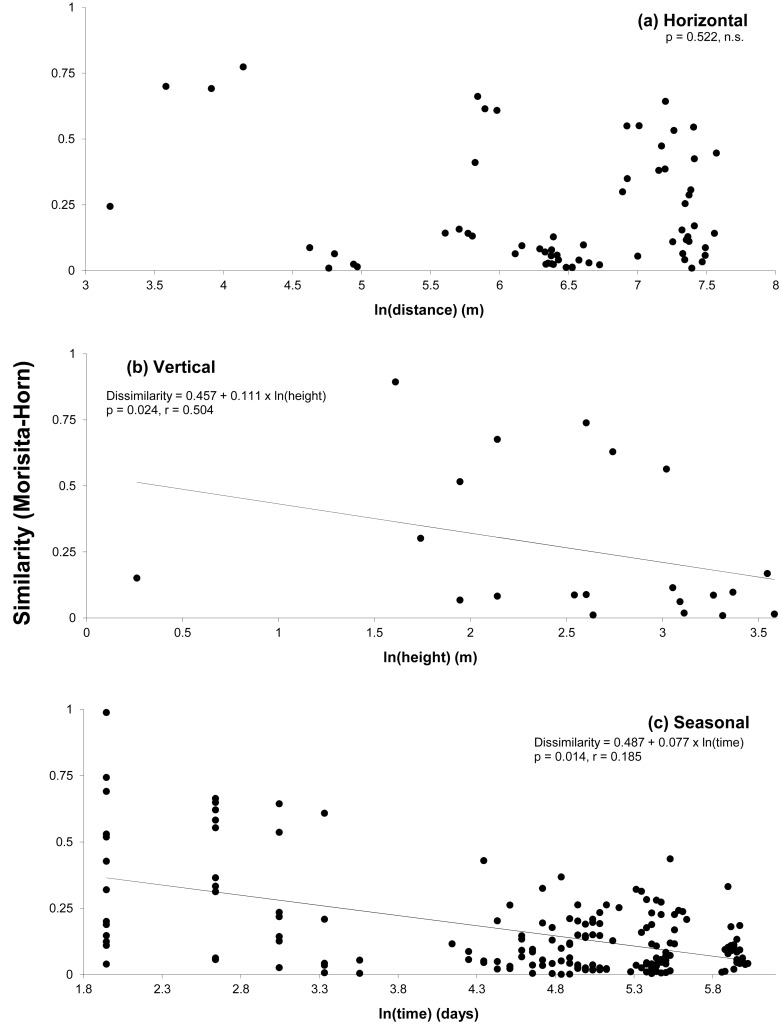
Fig 6. Arthropod species turnover, expressed by faunal similarity measured with the Morisita-Horn index, in the (a) horizontal, (b) vertical and (c) seasonal dimensions.
Shown are the parameters of pairwise dissimilarity regressed on pairwise log(distance), with p values based on 1,000 permutations of pairwise distance versus pairwise dissimilarity matrices, and the overall concordance (r) between the matrices of observed and estimated values. Plotted models refer to the decay of similarity (i.e. 1-dissimilarity), for more intuitive interpretation.

