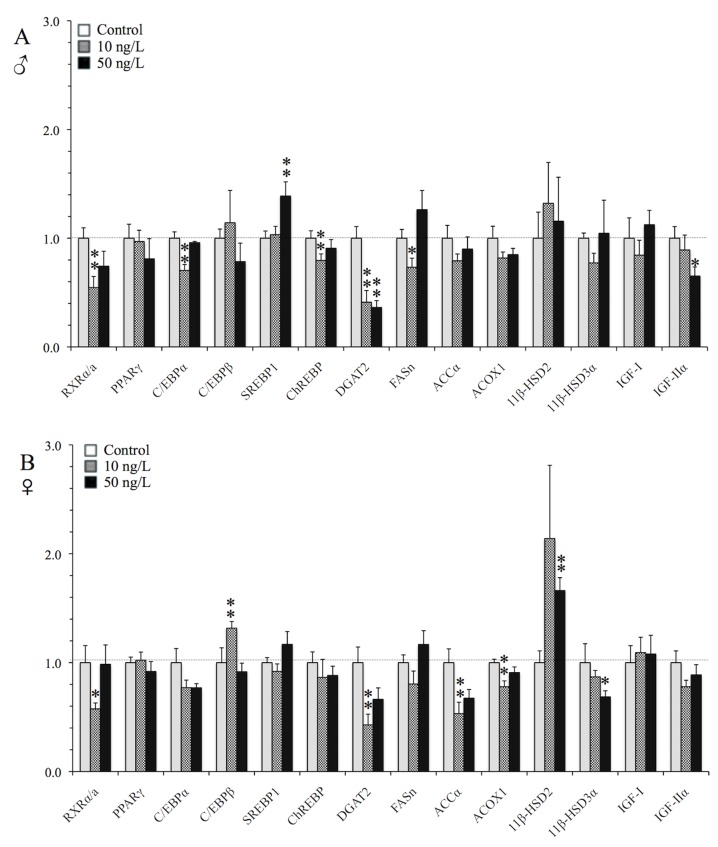
Fig 5. TBT in vivo induction of lipogenic genes in the brain.
qRT-PCR analysis of selected lipogenic transcription factors and metabolizing enzymes in the brain of (A) male, and (B) female zebrafish following chronic exposure (9 months) to waterborne 10 and 50 ng/L of TBT (as Sn). Values were normalized to β-actin and expressed as the average fold changes ± SEM (n = 7) of the solvent control group. **p<0.05 and *p<0.1 compared to solvent control (one-way ANOVA, followed by Dunnett’s test).

