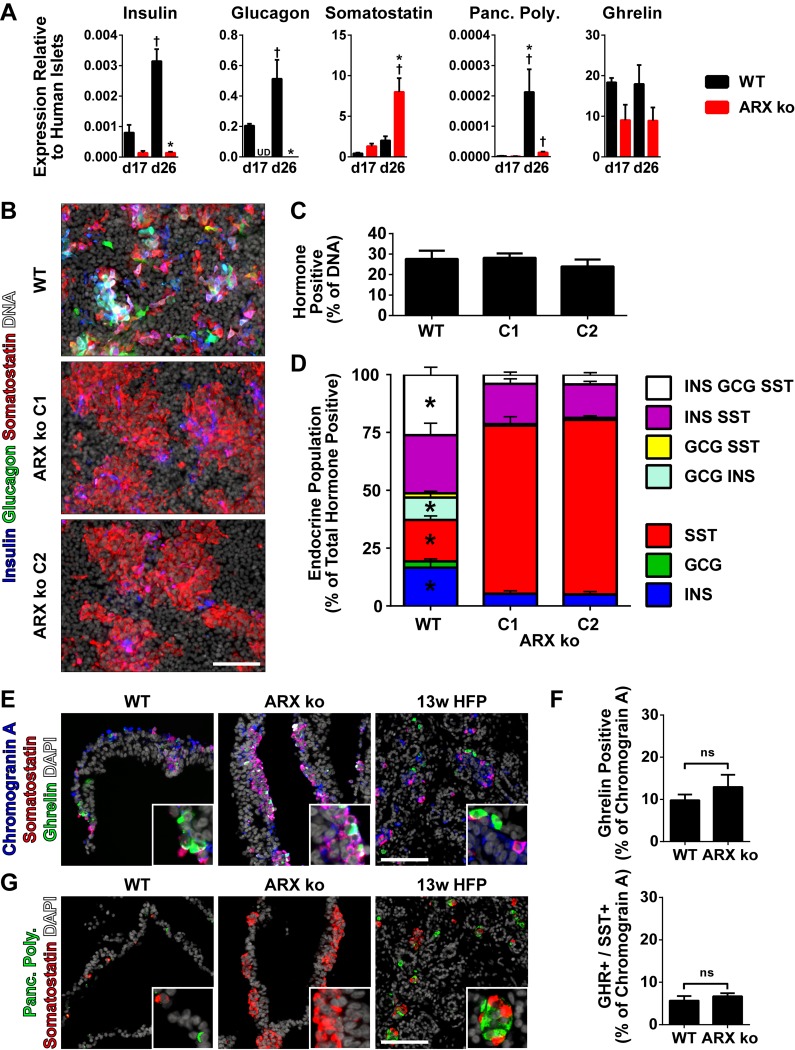
Fig 4. Pancreatic Endocrine Profile of ARX ko hESCs.
(A) RT-qPCR of day 17 and day 26 whole population samples examining the expression of the five major pancreatic hormones in wild type (WT; black bars) and ARX knockout clone 1 (ARX ko; red bars) relative to adult human islets expression levels. † indicates p < 0.05 within the genotype over time, * indicates p < 0.05 wild type vs ARX ko at given culture day. (B) 26-day differentiated cultures were stained in situ for insulin (blue), glucagon (green), somatostatin (red), and nuclei (white). (C) Image based cell counting was performed to determine the number of cells positive for any of the three hormones as a percentage of the total number of nuclei. (D) Single cell pancreatic endocrine population profile as a percentage of the total number of insulin, glucagon and somatostatin-positive cells. * indicates significant changes in the population between wild type and ARX ko (both clones). (E) Immunostaining of 13w HFP and 26-day differentiated wild type and ARX ko cells for chromogranin A (blue), somatostatin (red), ghrelin (green) and DAPI (white). (F) Single cell quantification of ghrelin-positive and ghrelin/somatostatin co-positive cells as a percentage of the total hormone (chromogranin A) positive fraction. (G) Immunostaining of pancreatic polypeptide-positive cells in day 26 cultures and 13w HFP with pancreatic polypeptide (green), somatostatin (red) and DAPI counterstain (white). Inset is a ~3x enlarged portion from the region indicated by the star. Scale bar is 100 μm for all panels.

