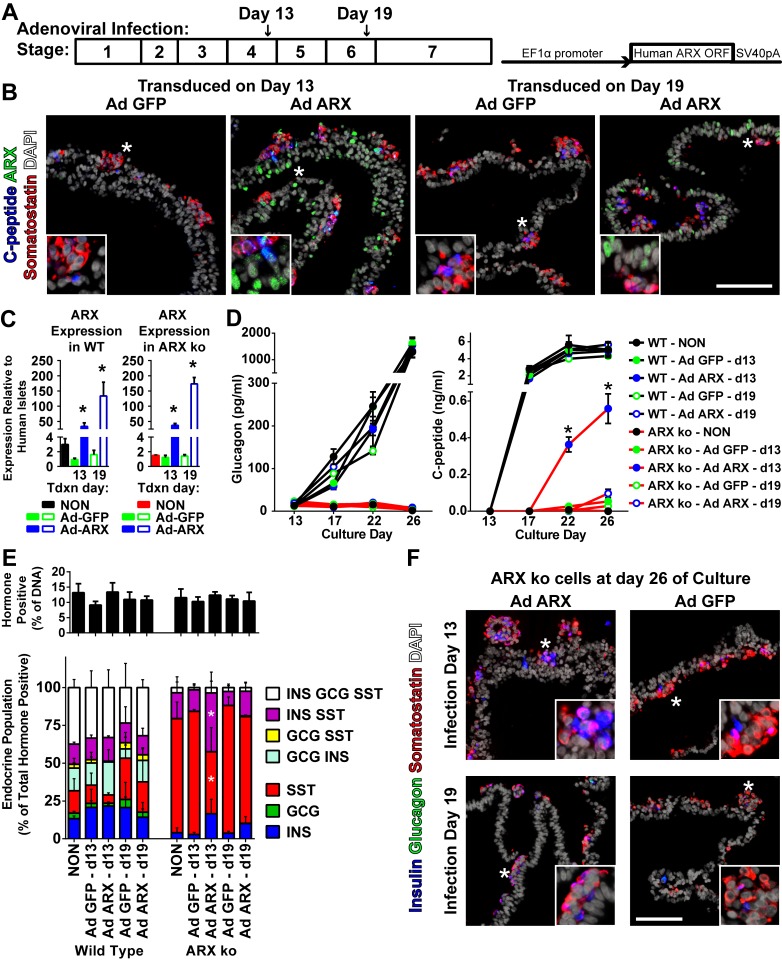
Fig 10. Adenoviral ARX Expression in Developing ARX ko hESCs.
(A) Schematic diagrams of adenoviral infection timeline during pancreatic differentiation stages and the adenoviral construct used to express human ARX under the constitutive EF1α promoter. (B) Immunostaining of ARX (green), somatostatin (red), and C-peptide (blue) in ARX knockout (ARX ko) cells differentiated to day 26 after transduction at day 13 or 19 with Ad GFP or Ad ARX. (C) RT-qPCR of day 26 whole population samples examining the expression of ARX in wild type (WT) (left graph) and ARX ko clone 1 (right graph) cells treated with Ad GFP (green bars) or Ad ARX (blue bars) at an MOI of 2 on day 13 (filled bars) or 19 (open bars). * indicates p < 0.05 Ad GFP vs Ad ARX from a given transduction (Tdxn) day. (D) Glucagon and C-peptide levels from 24-hour static media samples taken between days 13 and 26 comparing Ad ARX treatment in wild type cells (black lines) and ARX ko cells (red lines). Treatments are indicated by symbol colour in the figure. * indicates p < 0.05 Ad ARX on day 13 versus all other populations on day 22 and 26. (E—F) Immunostaining and single cell hormone analysis of Ad GFP and Ad ARX treated wild type and ARX ko day 26 cultures for insulin (blue), glucagon (green), and somatostatin (red). (E) Total number of hormone-positive cells (any combination of insulin, glucagon and or somatostatin) represented as a percentage of the total number of nuclei. Endocrine population breakdown of wild type and ARX ko cultures. * indicates p < 0.05 Ad ARX delivered on day 13 versus no virus (NON) and Ad GFP delivered on day 13 in ARX ko cells. N = 3 per group. Inset is a ~3x enlarged portion from the region indicated by the star. Scale bar is 100 μm for all panels.

