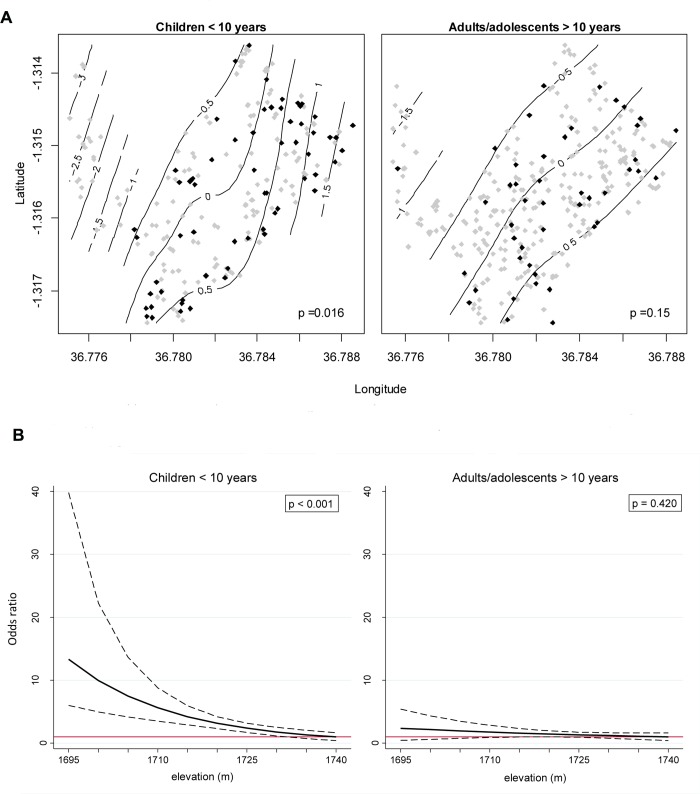
Fig 4. (A) Smoothed log odds (contours) of typhoid fever by age group across the study area, adjusted for age and household size, with cases (black points) and controls (grey points) overlaid.
P-values test for significance of the observed spatial pattern in log odds against a homogenous risk surface (i.e., where the log odds is zero at all locations). (B) Adjusted odds ratios from the multi-variate logistic model (Table 2) for the association between elevation and typhoid fever for both children (<10 years) and adults/adolescents (>10 years), with 95% CI overlaid (dashed lines). Odds ratio of 1 (ref odds = 1740 meters in elevation) indicated by horizontal red line.

