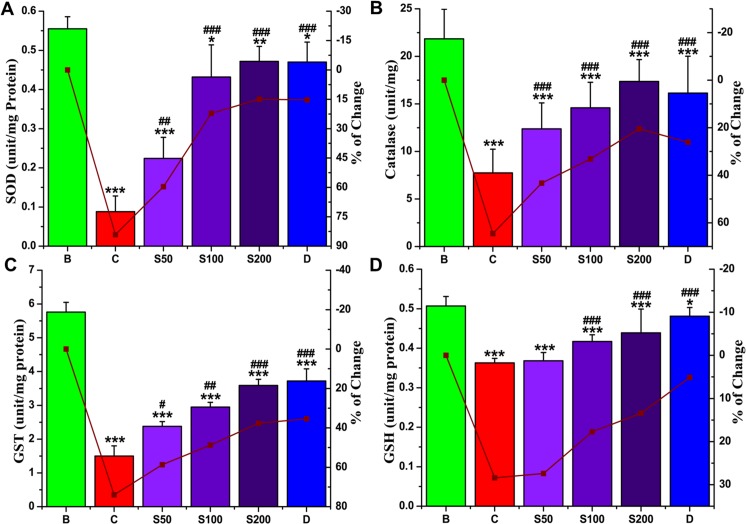
Fig 5. Effect of PNME on liver antioxidant enzymes level.
A. SOD, B. Catalase, C. GST, D. GSH. Mouse groups (blank, B; control, C; 50 mg/kg b.w. PNME, S50; 100 mg/kg b.w. PNME, S100; 200 mg/kg b.w. PNME, S200; desirox group, D) were treated as described in the ‘Experimental design and tissue preparation’ section. The values are expressed as the mean ± S.D. (n = 6). *p < 0.05, **p≤ 0.01, ***p≤ 0.001 compared with blank, and #p < 0.05, ##p≤ 0.01, ###p≤ 0.001 compared with control.

