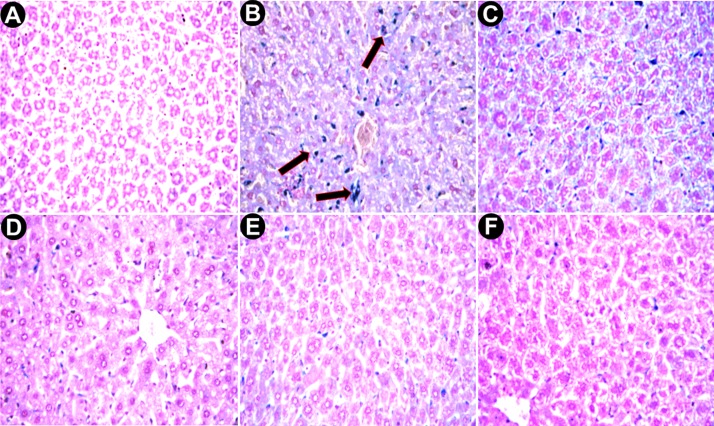
Fig 8. Microscopic observation of liver sections stained with Perls’ Prussian blue at 400x.
A. Liver section from control mice with normal hemosiderin deposition patch (very low). B. Liver section from the C group showing excess amount of blue patches (indicated with arrows). C. Liver section from the S50 group. D. Liver section from the S100 group. E. Liver section from the S200 group. F. Desirox-treated liver section shows gradual reduction of blue patches designate significant removal of iron.

