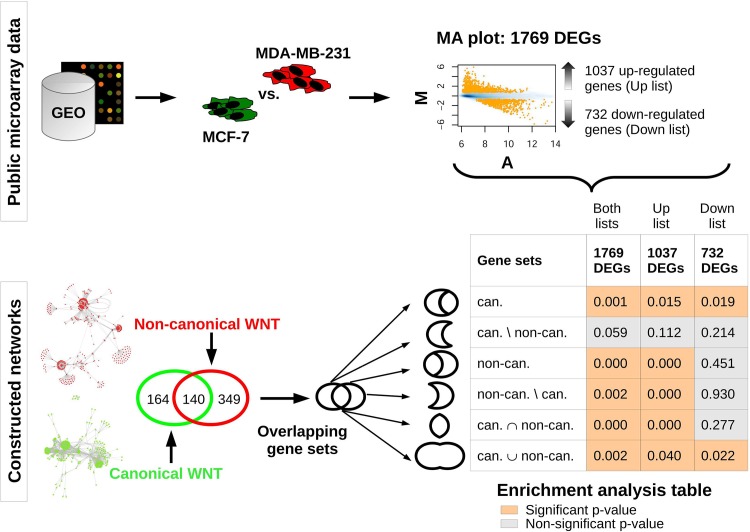
Fig 4. Workflow and delineation of enrichment analysis.
Upper part: Public microarray data were retrieved from the GEO repository and expression profiles of MCF-7 and MDA-MB-231 cell lines were compared, resulting in the identification of 1769 significantly differentially expressed genes (DEGs). These genes were separated into two lists: up-regulated and down-regulated genes in the MDA-MB-231 compared to the MCF-7 cell line. Lower part: Canonical and non-canonical network nodes were used to create gene sets represented by HUGO gene symbols. The two gene sets were further split into intersection and unique component subsets and merged into a union gene set. Lists of DEGs (up, down and both lists) were tested for enrichment in the WNT gene sets and subsets. Enrichment was considered significant for p-values < 0.05.

