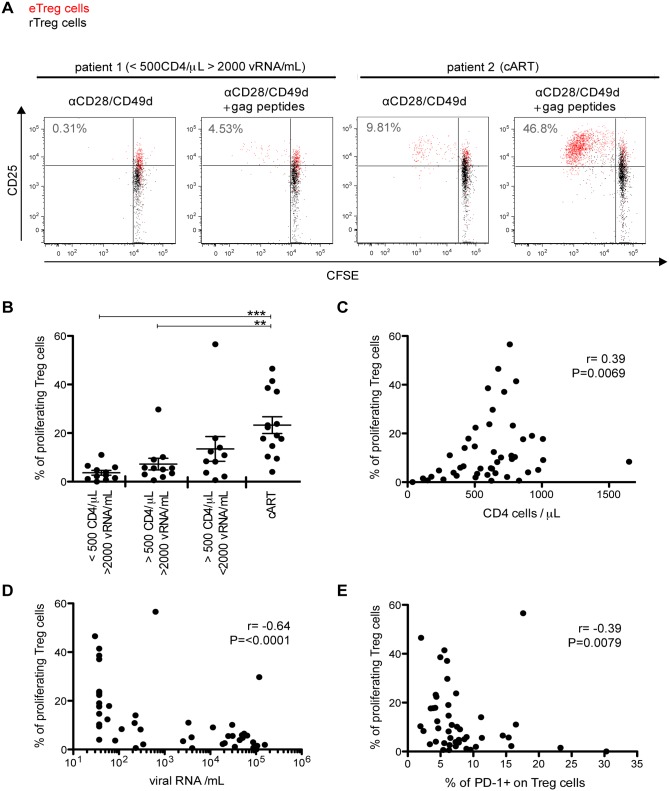
Fig 4. Treg cells from viremic individuals show impaired proliferative capacity that correlates with PD-1 expression.
CFSE-labelled PBMC from HIV-infected individuals were stimulated with Gag peptides for 6 days. (A) Flow cytometry dot plots showing CFSE dilution of Treg cells (eTreg cells in red and rTreg cells in black). Numbers indicate the percentage of proliferating Treg cells (including eTreg and rTreg). (B) The percentages of proliferating Treg cells (including eTreg and rTreg) from different HIV-infected study groups are given as indicated. Each dot represents the result from one HIV-infected individual. The mean ± SEM (standard error of the mean) is shown. Significant differences were determined by a Mann-Whitney U test, corrected for multiple comparisons using Bonferroni method, and indicated by asterisks (**p <0.01; ***p <0.001). Panels C to E show correlations between the percentage of proliferating Treg cells and CD4 T cell counts (C), HIV viral load (D), and PD-1 expression on Treg cells before stimulation (E), respectively. Spearman’s rank correlation coefficients (r) and p values (P) are indicated.

