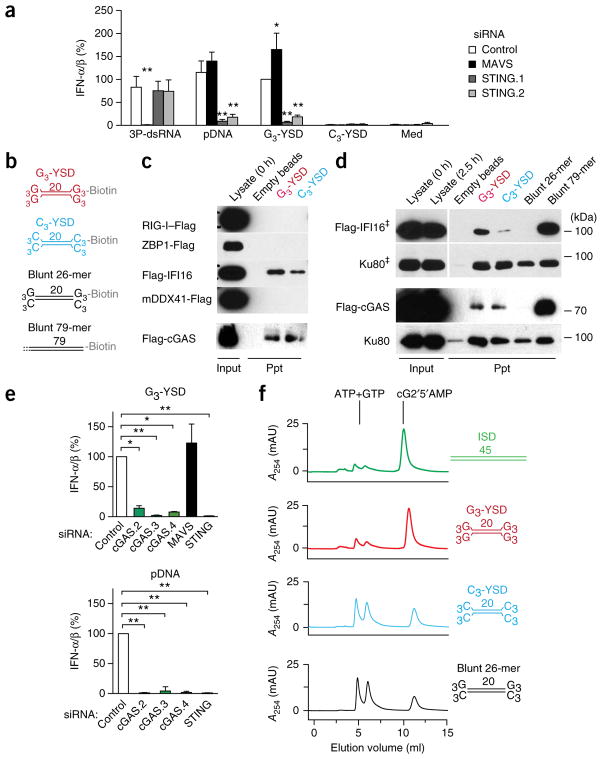
Figure 4.
G-YSD activates the cGAS-STING axis. (a) IFN-α/β activity in supernatants of THP-1 cells treated with control siRNA or siRNA targeting MAVS or STING (either of two target sequences (STING.1 or STING.2)) (key) and then, 72 h later, stimulated for 20 h with the RIG-I ligand 3P-dsRNA, plasmid DNA (pDNA), G3-YSD or C3-YSD; results are presented relative to those of THP-1 cells treated with control siRNA and stimulated with G3-YSD, set as 100%. (b) Secondary structures of biotinylated DNA duplexes used in interaction assays in c,d: G3-YSD or C3-YSD, or short, 26-nucleotide (26-mer) or long, 79-nucleotide (79-mer) blunt dsDNA. (c) Immunoblot analysis of Flag-tagged receptor candidates (left margin) with lysate alone (0.1 volume of the lysate used in the precipitation assays; Input) at the beginning (0 h) of the assay (far left lane) or after precipitation (Ppt) with empty beads (middle left lane) or with G3-YSD or C3-YSD (above lanes; as in b). (d) Immunoblot analysis of Flag-tagged IFI16 or cGAS or of the nonspecific DNA-binding control Ku80 with lysate alone (Input) at the beginning (0 h) or end (2.5 h) of the experiment, or after precipitation with empty beads, G3-YSD, C3-YSD (as in c), or with short (26-nucleotide) or long (79-nucleotide) blunt dsDNA (as in b) (above lanes). ‡, lysate and precipitate detection are from the same blot with one empty lane removed. (e) IFN-α/β in supernatants of THP-1 cells treated with control siRNA or siRNA targeting cGAS (one of three target sequences (cGAS.2, cGAS.3 or cGAS.4)), MAVS or STING (horizontal axes) and then, 48 h later, stimulated for 20 h with G3-YSD (top) or plasmid DNA (bottom); results are presented relative to those of THP-1 cells treated with control siRNA, set as 100%. (f) HPLC detecting the conversion of ATP and GTP to cG2′5′AMP (cyclic [G(2′,5′)pA(3′,5′)p]) by cGAS in the presence of ISD, G3-YSD, C3-YSD or the 26-nucleotide blunt DNA (without biotin) in b, presented (in milli-absorption units (mAU)) as absorption at 254 nm (A254). Sequences of DNA structures, Supplementary Table 1. *P ≤ 0.01 and **P ≤ 0.001, presented only for results significantly different from control (two-way ANOVA followed by Bonferroni’s post-hoc test (a) or one-way ANOVA followed by Tukey’s post-hoc test (e)). Data are pooled from three (a,e, bottom) or four (e, top) independent experiments with biological replicates (mean and s.e.m.) or are representative of three experiments (c,d,f).

