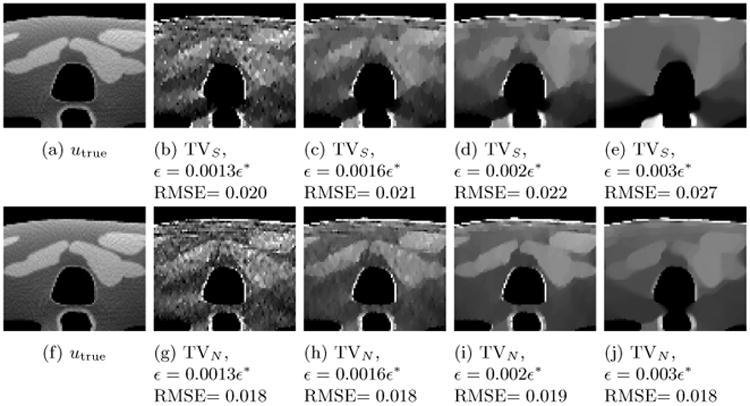
Figure 6.

Bin 1 (0-40keV) image, soft-tissue ROI comparison with channel-by-channel TV (top) and TVN (bottom). Grayscale window in cm−1 [0.30, 0.35]. The reference image *utrue is an FBP reconstruction of the fully sampled (1200 views) noiseless data.
