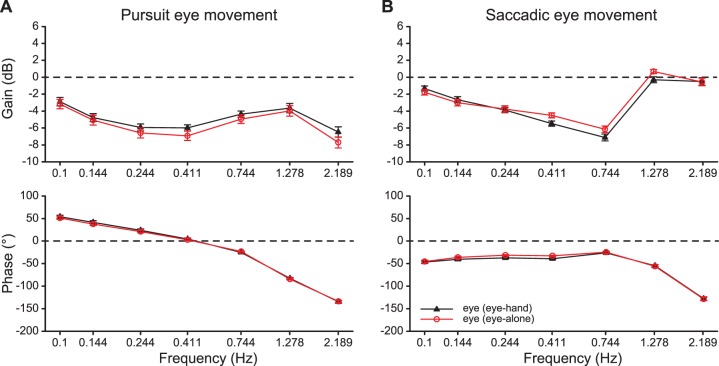
Figure 5.
Frequency-response (Bode) plots of smooth pursuit and saccadic eye tracking performance. (a) Mean smooth pursuit gain (top panel) and phase (bottom panel) and (b) mean saccadic tracking gain (top panel) and phase (bottom panel) averaged across 15 participants as a function of perturbation frequency for the eye-hand and the eye-alone tracking conditions. Error bars are SEs across 15 participants.

