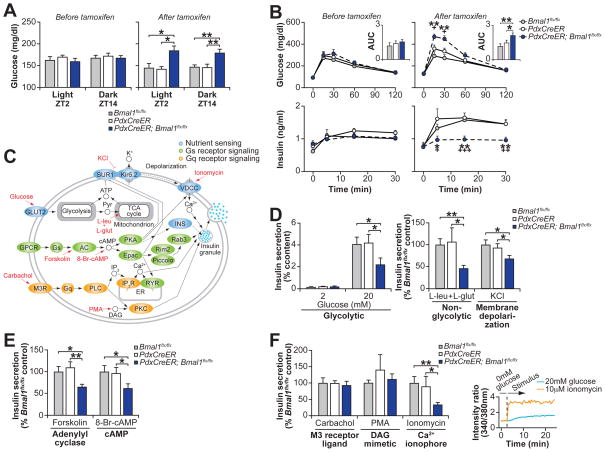
Fig. 4. Clock disruption in β-cells during adulthood causes acute hypoinsulinemic diabetes in mice.
(A) Blood glucose levels in ad libitum fed mice before and after tamoxifen administration (n=6–12 mice per genotype). (B) Glucose tolerance and insulin secretion at ZT2 following intraperitoneal glucose administration in PdxCreER;Bmal1flx/flx mice and littermate controls before and after tamoxifen treatment (n=4–11 mice per genotype). Inset represents area under the curve (AUC) for glucose (104 mg/dl/120min). (C) Model of intersecting pathways driving insulin exocytosis highlighting nutrient, Gs, and Gq receptor signaling that are used to stimulate insulin secretion in (D–F). (D) Glucose and nutrient-stimulated, (E) cyclase-pathway, and (F) catecholamine-stimulated insulin secretion in islets isolated from tamoxifen-treated PdxCreER;Bmal1flx/flx and control mice (n=3–8 mice per genotype, 3 repeats per mouse). Inset is ratiometric determination of intracellular Ca2+ using Fura2-AM dye in Beta-TC6 cells in response to insulin secretagogues (n=3 replicates per condition). All values represent mean ± SEM. For (B), asterisks denote significance between Bmal1flx/flx and PdxCreER;Bmal1flx/flx, while plus symbols denote significance between PdxCreER and PdxCreER;Bmal1flx/flx. *p<0.05, **p<0.01, ***p<0.001

