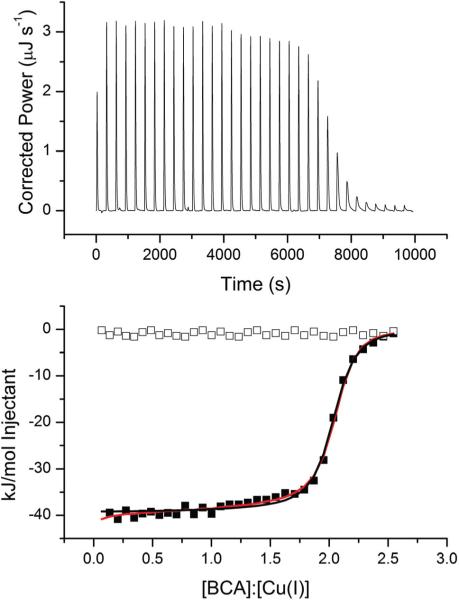
Fig. 4.
Representative ITC titration of 1.0 mM BCA into 125 μM Cu+ in 25 mM HEPES, 100 mM NaCl and 25 mM MeCN at pH 7.0 on a TA Instruments Nano ITC. The black line indicates the best fit using a one-site binding model (n = 2.01 ± 0.06, K = 1.7 ± 0.2 × 10⁶, ΔH = −37.3 ± 0.2 kJ mol−1, RSS/DoF = 7.71) and the red line represents the best fit using a sequential binding model (K1 = 8.9 ± 0.7 × 10⁵, ΔH1 = −42.0 ± 0.2 kJ mol−1, K2 = 1.1 ± 0.1 × 10⁶, ΔH2 = −36 ± 1 kJ mol−1, RSS/DoF = 4.07). Open boxes indicate the heat of BCA dilution.

