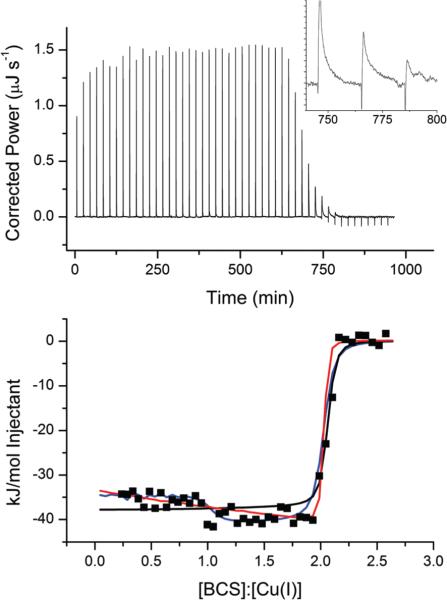
Fig. 5.
Representative ITC titration of 1.0 mM BCS into 125 μM Cu+ in 25 mM Tris, 100 mM NaCl and 25 mM MeCN at pH 8.0 on a TA Instruments Nano ITC. The solid black line indicates the best fit using a one-site binding model (n = 2.03 ± 0.01, K = 1.8 ± 0.9 × 10⁷, ΔH = −37.9 ± 0.4 kJ mol−1, RSS/DoF = 157) and the blue and red lines represent two independent fits using a sequential binding model (Blue: K1 = 1.5 ± 0.1 × 10⁹, ΔH1 = −34.7 ± 0.5 kJ mol−1, K2 = 4.75 ± 0.4 × 10⁶, ΔH2 = −41.2 ± 0.6 kJ mol−1, RSS/DoF = 50.5; Red: K1 = 1.5 ± 0.6 × 10⁸, ΔH1 = −33 ± 1 kJ mol−1, K2 = 4 ± 1 × 10⁷, ΔH2 = −42 ± 1 kJ mol−1, RSS/DoF = 67.75). The insert shows an expansion of the last three exothermic injections.

