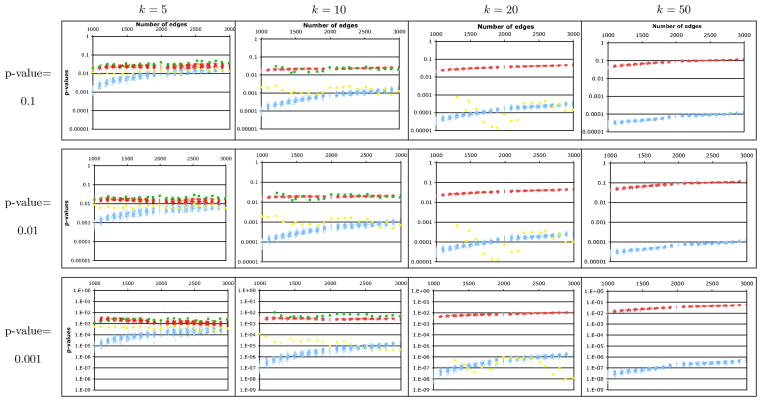
FIG. 3.
P-values predicted by our four approximation schemes (normal, red; Y-convolution, blue; triangle convolution with rounding, yellow; triangle convolution with interpolation, green) for the TPD clustering measure. Each data point records the approximated p-value (y-axis) for the TPD score that obtained the given empirical p-value (0.001, 0.01, 0.1), on a random scale-free graph with 1000 vertices and the given number of edges (x-axis). The triangle convolution with rounding method was too slow to be evaluated for k > 20, and that with interpolation could only be run for k = 5 and k = 10.

