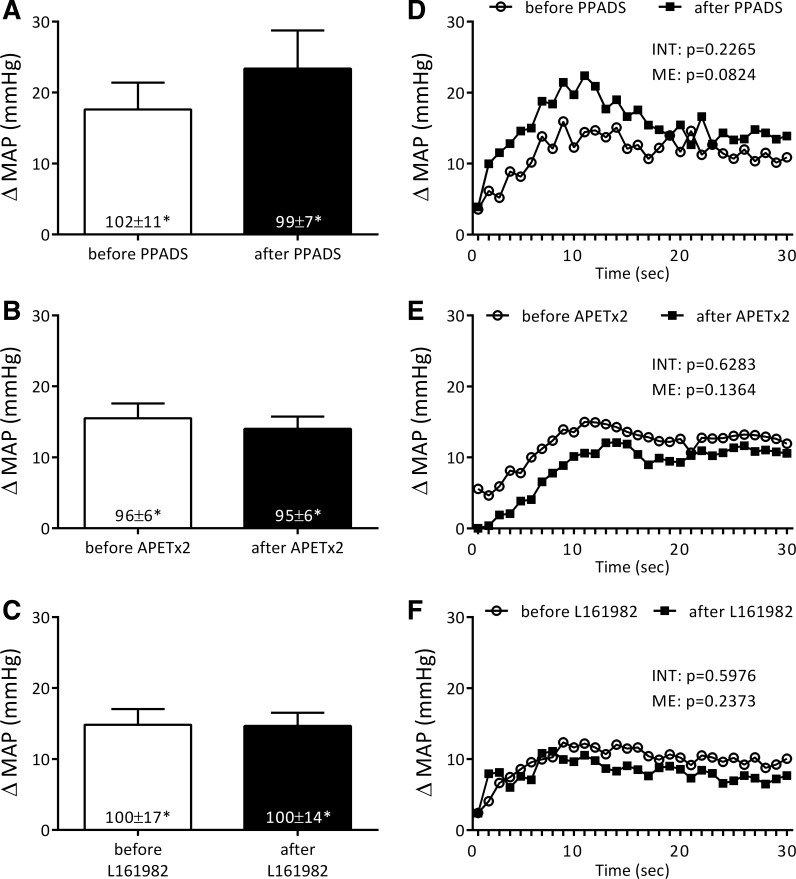
Fig. 1.
Pressor responses to static contraction before and after blockade of individual activating acid-sensing ion channel 3 (ASIC3), P2X, and EP4 receptors. Peak pressor responses to static contraction before and after PPADS (A; n = 5), APETx2 (B; n = 6), and L161982 (C; n = 6). Time courses, plotted second by second, of the changes in mean arterial pressure (MAP) averaged for each second of contraction before and after PPADS (D), APETx2 (E), and L161982 (F). For purpose of illustration, SE bars were omitted. *Increases in MAP were significantly greater than their respective baseline levels in A–C.

