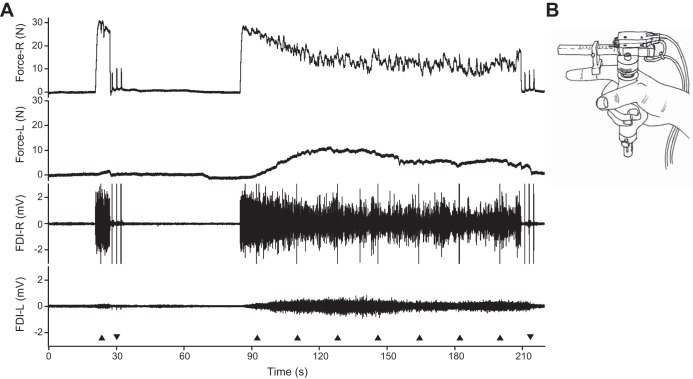
Fig. 2.
A: Force and electromyographic (EMG) data recorded from a participant with SCI during the sustained contraction showing the target force (R), associated nontarget force (L), EMG of target FDI (R), and nontarget FDI (L). Black triangles (base down) indicate one pair of stimuli (10-ms interval), triangles (base up) indicate three double pulses at rest. B: illustration of a hand holding the force transducer. During the experiment the thumb and fingers are taped to each other to prevent changes in hand position.

