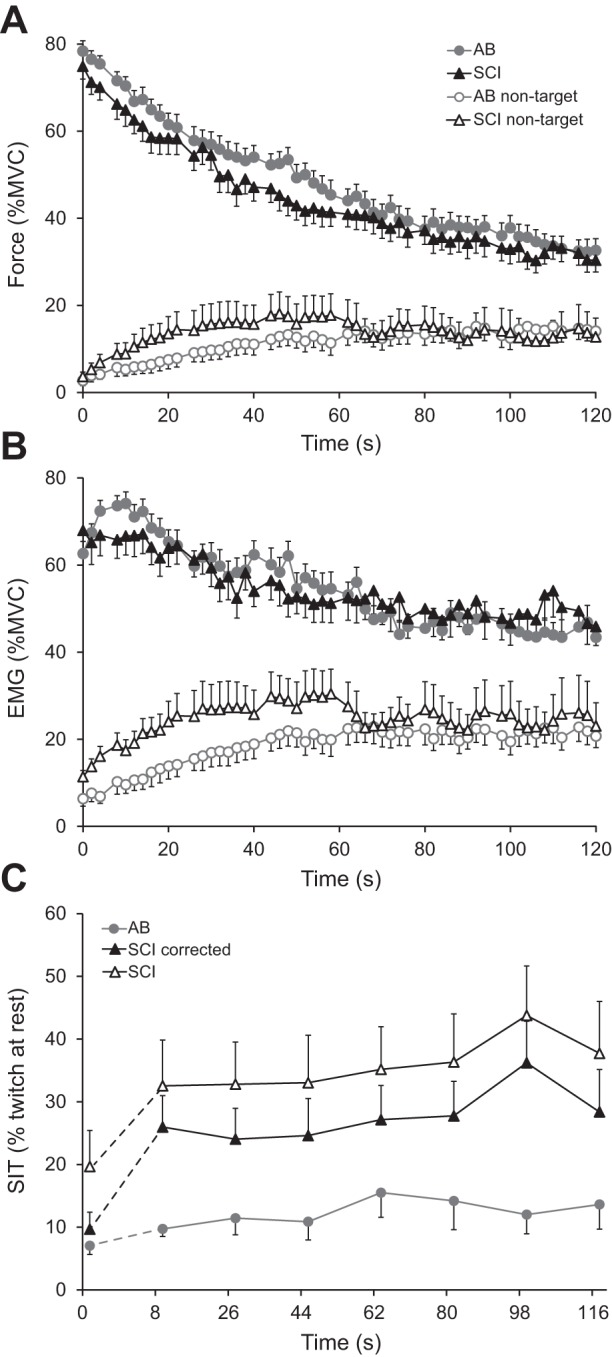
Fig. 4.

Mean (SE) force (A) and root-mean-square (RMS) of the electromyographic signal (B) (each 2-s epochs) during the sustained MVC for the target (filled symbols) and nontarget (open symbols) FDI of the SCI (black triangles) and AB group (gray circles). C: mean (SE) superimposed twitches during the brief MVC (0 s) and the sustained MVC (n = 7) for AB (gray) and SCI participants (black). Filled symbols represent twitches corrected for both the SCI-related-superimposed twitch and peripheral fatigue (see Equation 3). The increase in the (corrected) twitch between from 0 to 8 s is significantly larger in participants with SCI than in AB participants.
