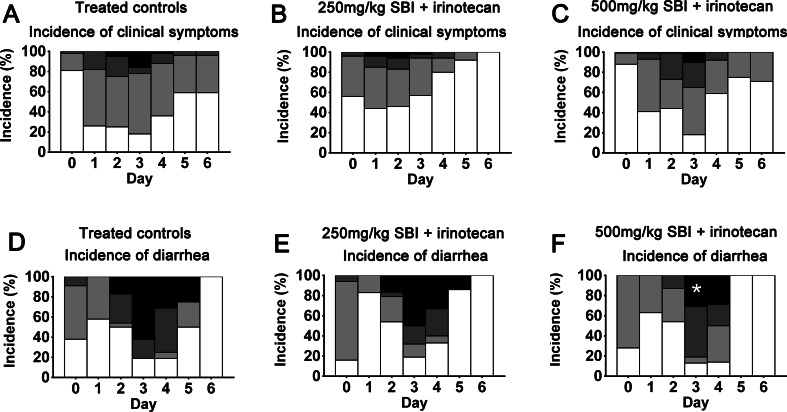
Fig. 2.
Incidence of clinical signs of stress and diarrhoea. Graphs represent incidence of daily scores for each group, expressed as a percentage. Statistical significance for decreased grade 3 diarrhoea on day 3 in animals treated with 500 mg/kg SBI and irinotecan vs irinotecan controls (log rank P value = 0.0219, 31 vs 62 %) is marked with an asterisk

