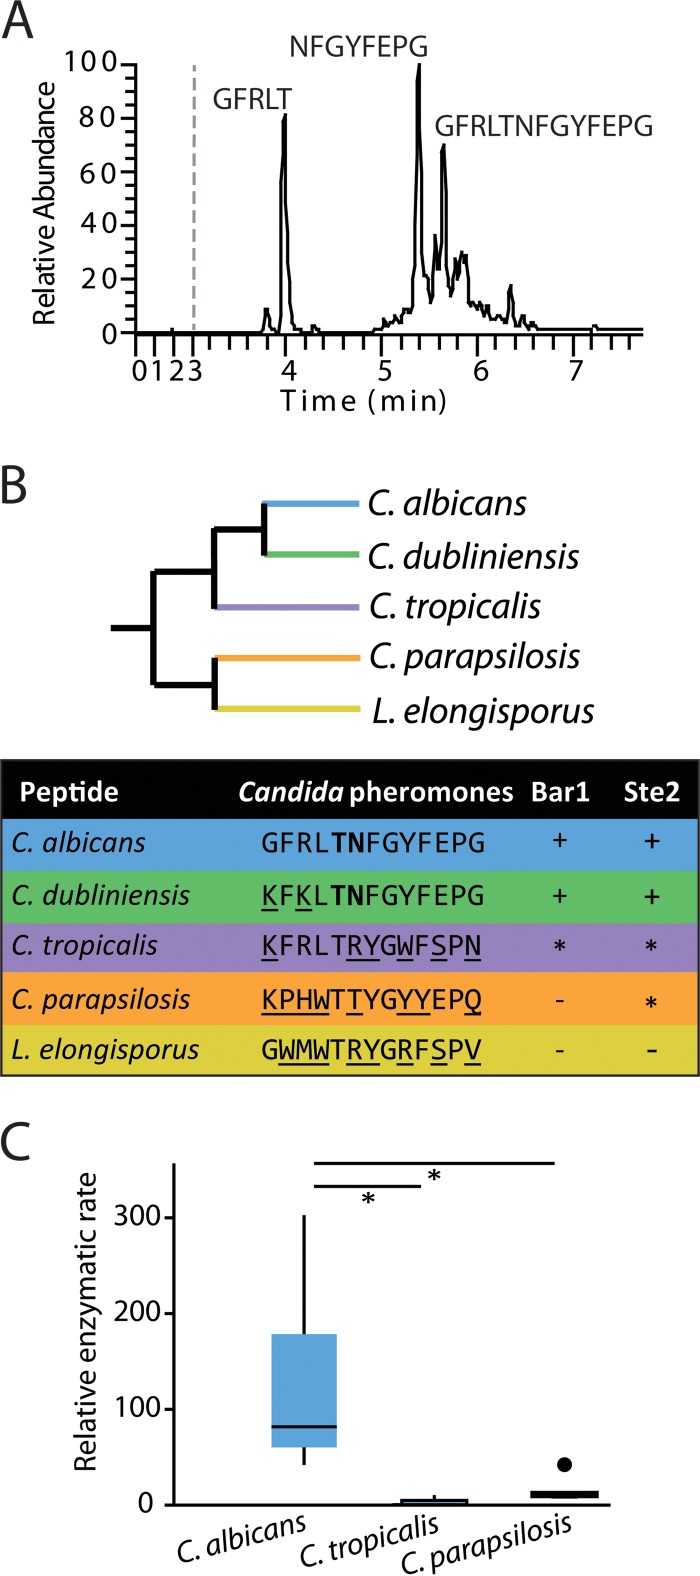
FIG 3 .
Analysis of C. albicans Bar1 protease activity on α pheromones from multiple Candida species. (A) Cleavage of C. albicans α pheromone by C. albicans Bar1 protease. Bar1 and α pheromone were coincubated for 1 h, and the products were analyzed by LC-MS. Mass spectrometry identified two major products (GFRLT and NFGYFEPG), as well as uncleaved pheromone (GFRLTNFGYFEPG). (B) An unrooted, phylogenetic tree of multiple Candida clade species is shown, as well as the activity of Bar1 on α pheromone peptides from each species. The detection of specific degradation products after 1 h of coincubation is indicated by “+” in the Bar1 column. “−” indicates no products were detected, while “*” indicates products were formed only after an extended (24-h) incubation. Boldface residues indicate amino acids adjacent to the cleavage site. The Ste2 column indicates whether the pheromone induced a robust response (+), a weak response (*), or no response (−) in C. albicans MTLa cells. Ste2 data are presented as adapted from Alby and Bennett (49) (see Fig. S2 in the supplemental material). (C) Bar1 activities were compared on C. albicans, C. tropicalis, and C. parapsilosis α pheromones using internally quenched (IQ) peptide substrates. Purified Bar1 was incubated with α pheromones for 90 min at 37°C. Relative enzymatic rate is the amount of fluorescence per unit of time due to cleavage of the fluorophore-conjugated peptide. Shown is a Tukey box plot with outliers noted by a large dot. n ≥ 5. *, P < 0.05 by Mann-Whitney U test.

