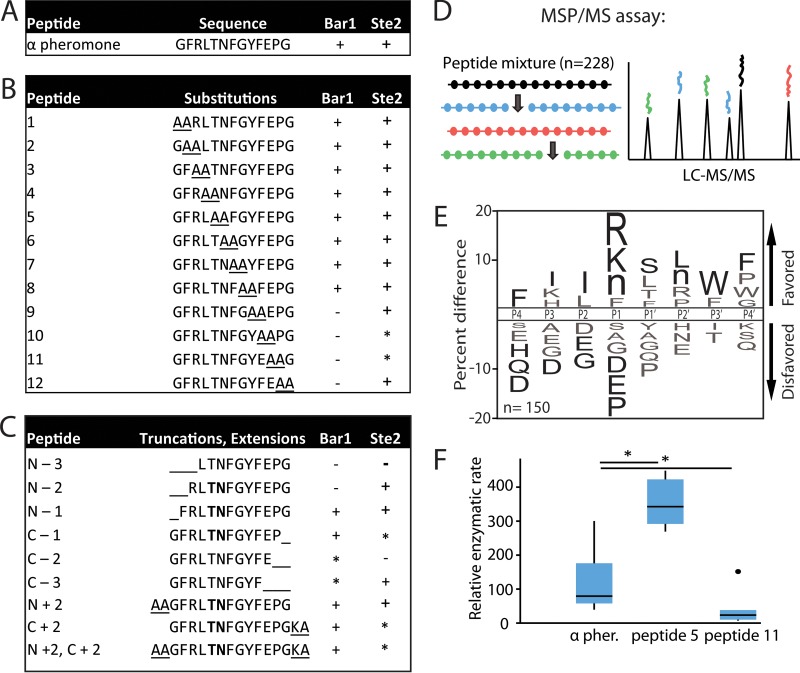
FIG 4 .
C. albicans Bar1 degradation of α pheromone analogs. Recombinant Bar1 was incubated for 1 h at 37°C with the indicated peptides, and the products were analyzed by mass spectrometry. (A) C. albicans α pheromone; (B) di-alanine substitutions within the C. albicans α pheromone sequence; (C) peptides corresponding to truncated or extended α pheromone. The detection of specific degradation products after 1 h of incubation is indicated by “+” in the Bar1 column. “−” indicates no products were detected, while “*” indicates products were formed only after extended (24-h) incubation. Boldface residues indicate amino acids flanking the cleavage site. The Ste2 column indicates whether the pheromone induced a robust response (+), a weak response (*), or no response (−) in C. albicans MTLa cells using published data in conjunction with data in Fig. S2 in the supplemental material (49). (D) Overview of the multiplex substrate profiling by mass spectrometry (MSP-MS) assay. C. albicans Bar1 was coincubated with 228 unique dodecapaptides, and cleavage products identified using mass spectrometry. (E) MSP-MS data were used to generate an iceLogo identifying amino acids that were enriched or selected against in Bar1 cleavage sites. The percentage of difference is the difference in amino acid frequency surrounding the cleavage sites relative to the frequency of amino acids surrounding all peptide bonds in the library (n = 2,964). Residues above the midline are favored, while those below the midline are disfavored. Residues colored black significantly influence Bar1 activity (P < 0.05), whereas residues colored gray did not reach significance. Methionines were replaced with norleucines in the peptide library and are represented as “n.” (F) Enzymatic activity of Bar1 on substituted forms of α pheromone. Internally quenched peptides included α pheromone with alanine substitutions at positions P1 and P1′ or positions P6′ and P7′ corresponding to peptides 5 and 11 in panel B. The relative enzymatic rate is the amount of fluorescence per unit of time due to cleavage of the fluorophore-conjugated peptide. Rates were normalized to the Bar1(D232A) mutant control. Shown is a Tukey box plot with outliers noted by a large dot. n ≥ 5. *, P < 0.05 by Mann-Whitney U test.

