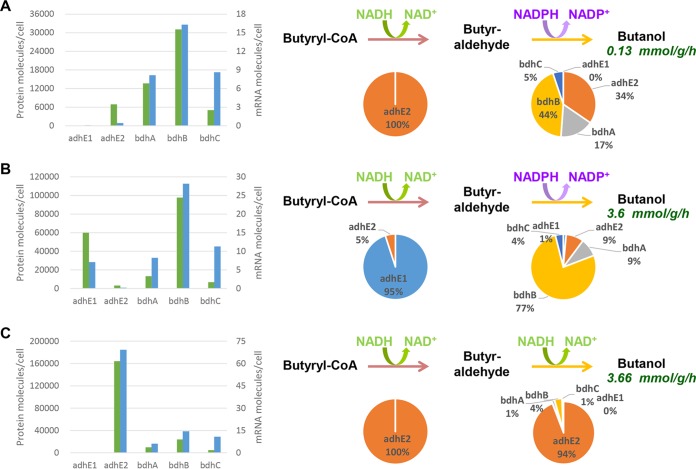
FIG 1 .
Butanol pathway analysis under acidogenesis (A), solventogenesis (B), and alcohologenesis (C). (Left) Numbers of mRNA (blue) and protein (green) molecules per cell for the five enzymes potentially involved in butanol production. (Right) Activity distributions of the five enzymes are shown for each step under the arrows. The primary cofactors used for each step are shown over the arrows. Butanol flux is indicated under the word “Butanol.”

