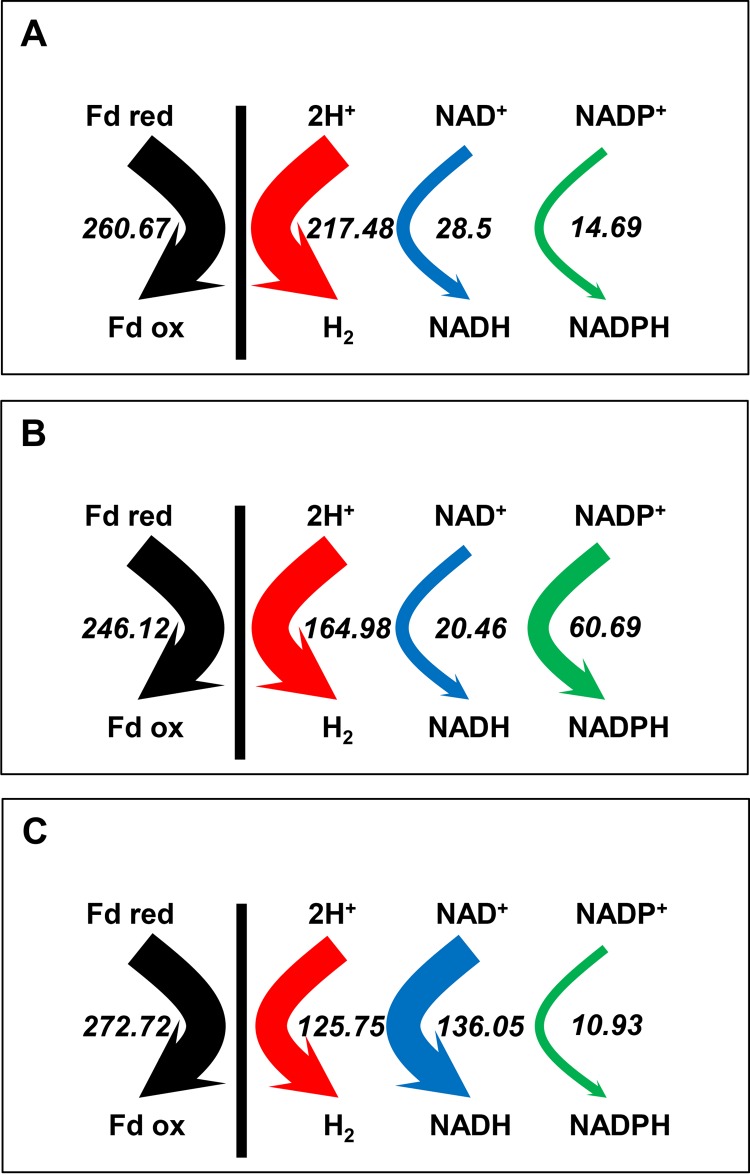
FIG 2 .
Electron flux map: acidogenesis (A), solventogenesis (B), and alcohologenesis (C). The hydrogenase (red), ferredoxin-NAD+ reductase (blue), and ferredoxin-NADP+ (green) in vivo fluxes are presented. All values are normalized to the flux of the initial carbon source (millimoles per gram [DCW] per hour). Glucose flux is normalized as 100 for acidogenesis and solventogenesis, and the sum of glucose and half of the glycerol is normalized as 100 for alcohologenesis.

