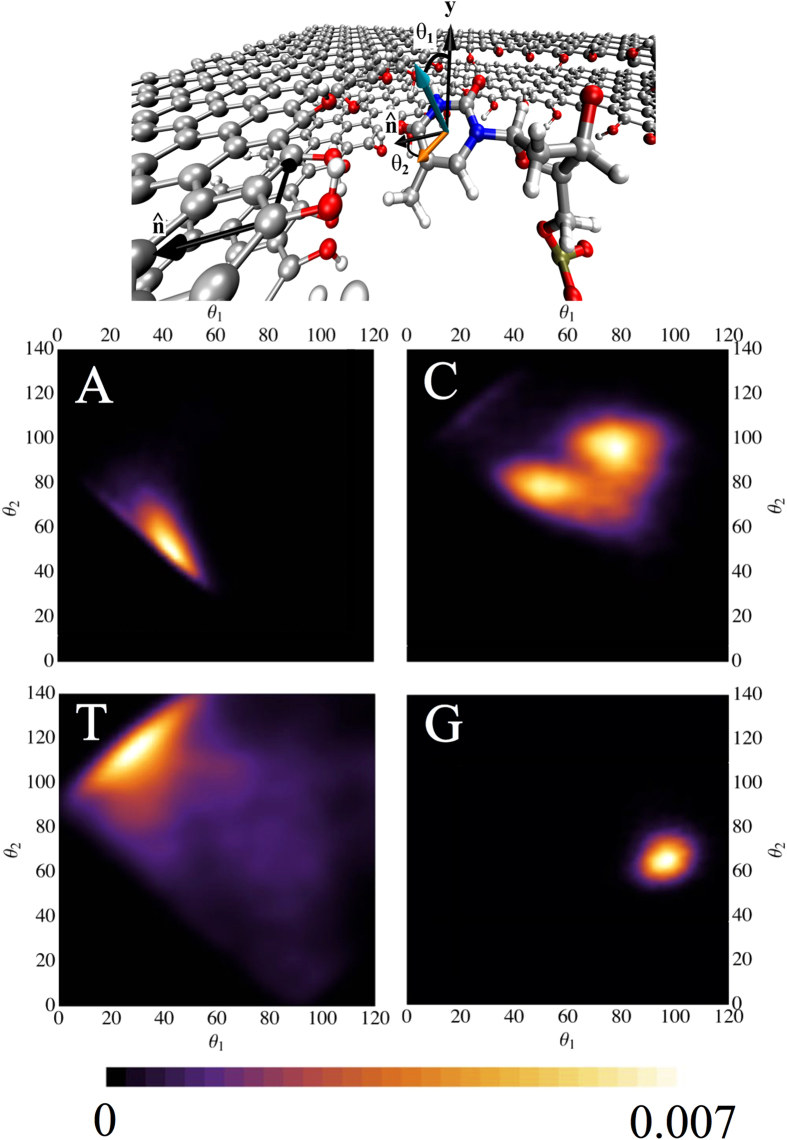
Figure 3. Top panel: Representation of a single snapshot of the dynamics for T.
The angle θ1 is defined as the angle between the normal to the plane of the nucleobase (cyan arrow) and the y axis (the normal to the plane of graphene), and θ2 is the angle formed between the projection of the normal to the nucleobase onto the plane of graphene (orange arrow), and the vector normal to the circumference of the nanopore,  . Lower Panels: Histogram of the probability density of angles between each nucleobase and the nanopore in bilayer graphene.

