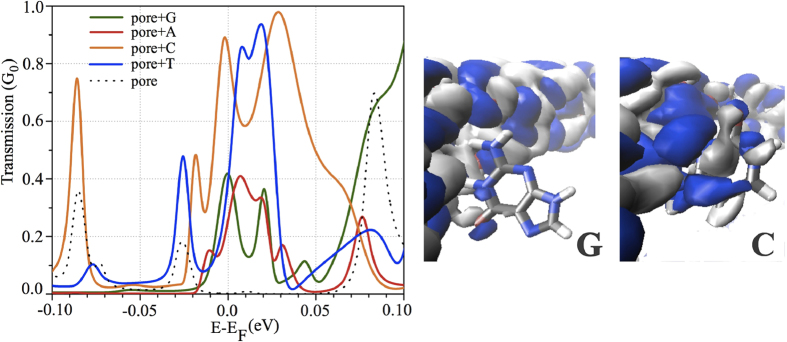
Figure 4. Left panel: The transmission coefficients of the four target nucleobases (G, A, C, T) yielding maximum conductance, as compared to that in the absence of nucleobases.
Right panel: The scattering state of the highest conducting channel of C and G shown in the left panel. The colors indicate the two different signs of the real-valued wavefunction.

