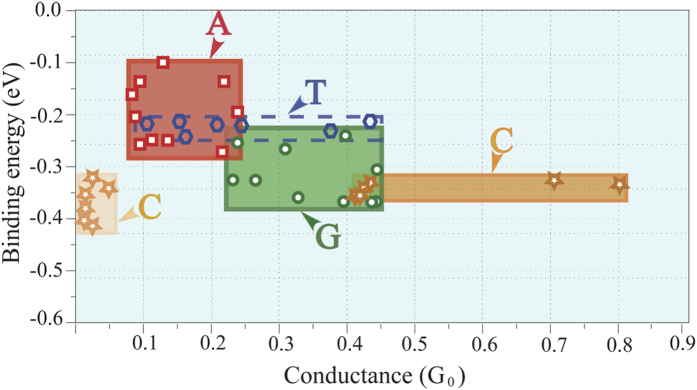
Figure 5. The conductance vs. binding energy of the four target nucleobases (G, A, C, T).
Note that we selected some configurations providing strong coupling between the nucleobase and pore edges from MD snapshots. The rectangle represents the region of the conductance vs. binding energy variations of each nucleobase.

