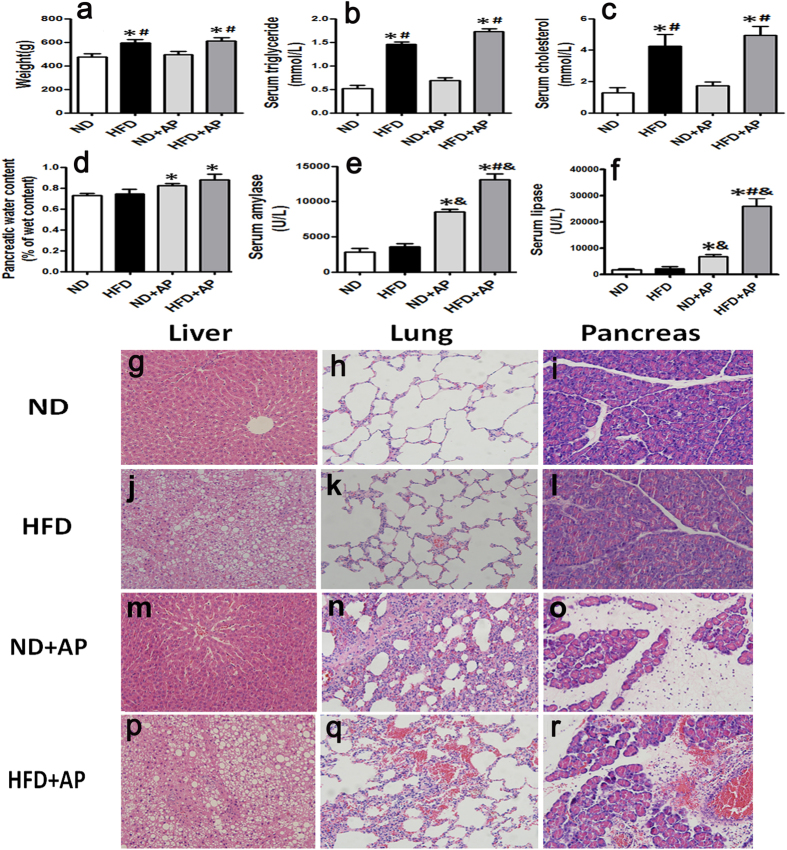
Figure 1. Detection of pancreatitis markers and tissue morphology in the HSAP and NHSAP models.
The body weight (a), serum triglyceride (b), cholesterol (c), pancreatic water content (d), serum amylase (e), and lipase (f) were measured after induction of AP. *P < 0.05 vs. the ND group. #P < 0.05 vs. the ND + AP group. &P < 0.05 vs. the HFD group. H&E staining: structure of normal liver (g,m), lung (h,k) and pancreas (i,l); liver structure of rat with HFD (j); after establishment of AP, the structure of pancreas and lung in HSAP rats (r,q) and NHSAP rats (o,n).

