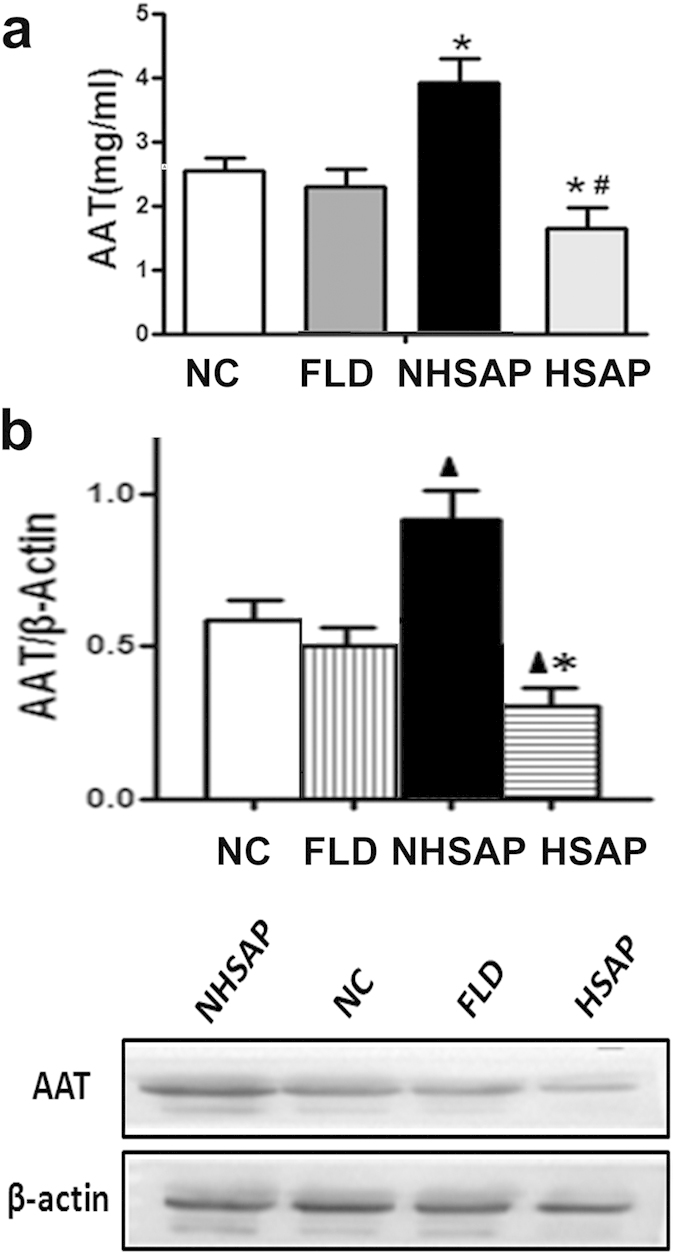
Figure 5. Patient serum AAT levels quantified by ELISA and western blot.

(a) Serum AAT levels were measured by ELISA in 60 patients with NHSAP, 60 healthy controls, 60 patients with FLD, and 60 patients with HSAP. *P < 0.01 vs. healthy controls. #P < 0.001 vs. the NHSAP group. (b) Serum AAT levels were quantified by western blotting in the above four groups. Quantification showing the relative levels of AAT in the four groups. ▲P < 0.01 vs. healthy controls. *P < 0.001 vs. the NHSAP group.
