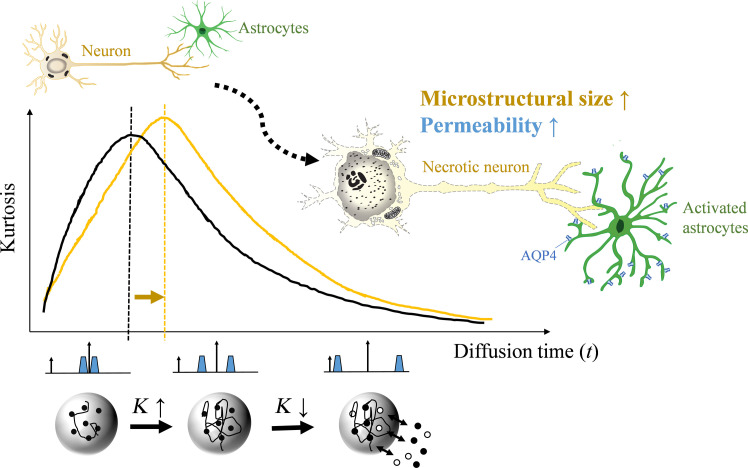
Fig. 1. Schematics of tDKI in measuring microstructural size and membrane integrity.
Normal neuron and astrocyte morphology is shown in the top left cartoon. Diffusion kurtosis (K) in biological tissues changes nonmonotonically as t increases, with an initial rise attributed to the water-restrictive effects of tissue barriers, followed by a descent as water molecules exchange between the intra- and extracellular spaces. We hypothesize that the peak t of the tDKI curve indicates the ensemble-averaged size of tissue barriers or effective structure size, while the postpeak descending curve reflects membrane permeability due to water redistribution, thereby enabling the assessment of key neuropathological features following hypoxic-ischemic stroke-like brain injuries, including neuronal swelling and membrane disruption, astrocytic activation and fragmentary degeneration, and changes of transmembrane water exchange.

