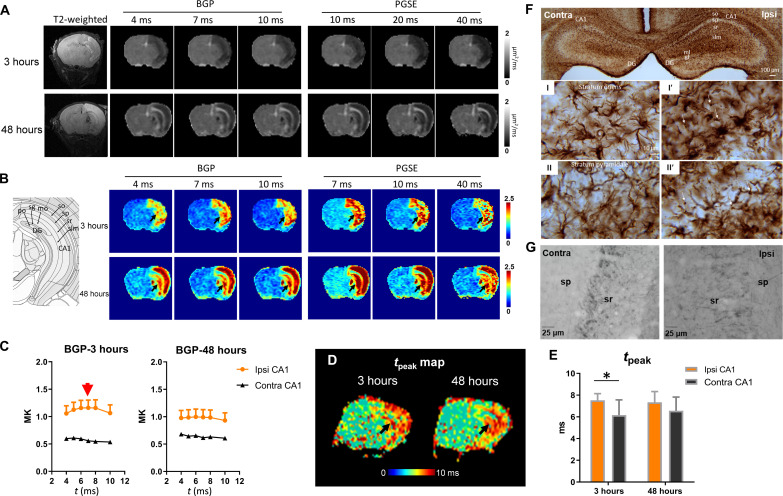
Fig. 4. tDKI-based tpeak and microstructural size alterations in a mouse model of neonatal HI injury.
(A and B) Diffusivity and kurtosis maps of a severely injured mouse brain scanned at 3 and 48 hours after the HI onset with t ranging from 4 to 40 ms using a bipolar pulsed gradient (BPG) and PGSE sequences. (C) t-dependent change in BGP-based mean kurtosis (MK) showed a peak around 7 ms (red arrow) in the ipsilateral CA1, while the contralateral CA1 did not show an apparent peak. (D) The tpeak map showed increased tpeak in the hippocampus (black arrows) of the HI-injured brain at 3 and 48 hours after HI. (E) Statistical comparison of peak positions in the ipsilateral and contralateral CA1 at 3 and 48 hours after HI (n = 6). *P < 0.05 by paired t test. (F) GFAP staining at 3 hours post-HI shows evident swelling of astrocytic body and processes, as well as beading in the astrocytic feet in stratum oriens (I′) and stratum pyramidale (II′) of the ipsilateral hippocampus (thin arrows). (G) Neurofilament staining showed axonal disruption and swelling in the stratum pyramidale and stratum radiatum of the ipsilateral hippocampus. contra, contralateral; ipsi, ipsilateral; sr, stratum radiatum; sp, stratum pyramidale; HP, hippocampus; DG, dentate gyrus.

