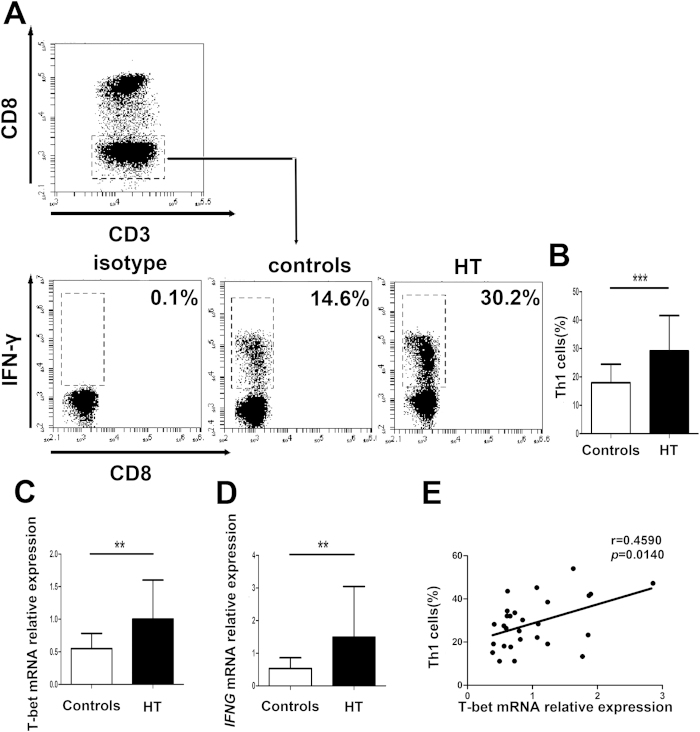
Figure 1. Increased circulating Th1 cells in peripheral blood from HT patients.
Peripheral blood was obtained from 28 HT patients and 20 healthy controls. (A) Representative flow cytometry dot plots of Th1 cells in HT patients and healthy controls are shown. Values in the upper left rectangular region correspond to the proportion of Th1 cells. We used isotype control to determine the positive cells, and all of the values were gated on CD3+ CD8- cells. (B) The percentages of Th1 cells were compared between HT patients and healthy controls. (C) The transcript level of T-bet mRNA in PBMCs from HT patients and healthy controls was determined by qRT-PCR. (D) The transcript level of IFNG mRNA in PBMCs from HT patients and healthy controls was determined by qRT-PCR. (E) The correlation between the transcript level of T-bet mRNA and the percentage of Th1 cells in peripheral blood from 28 HT patients. Each data point represents an individual subject, horizontal lines show the mean. *p < 0.05; **p < 0.01.

