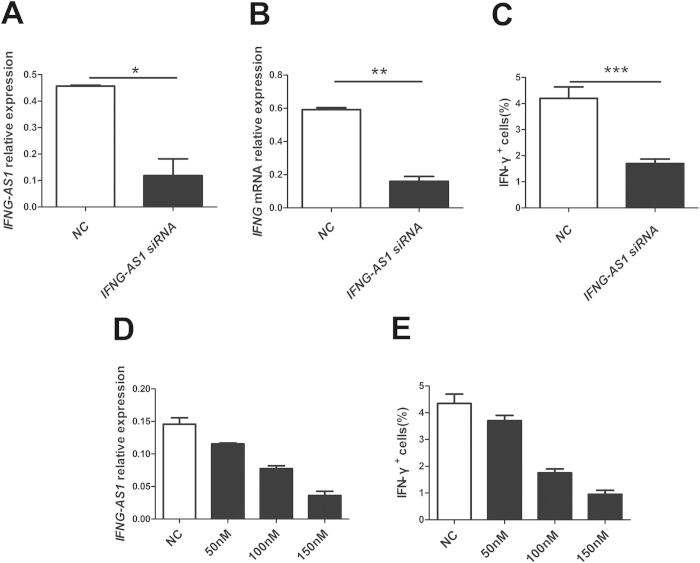
Figure 3. Influence of IFNG-AS1 on the transcription of IFNG in vitro.
Human CD4+ T cells were purified from PBMCs by magnetic beads and transfected with IFNG-AS1 -specific siRNA and negative control (100 nM) in the presence of functional anti-human CD3 mAb and anti-human CD28 mAb for 24 h to determine the transcript level of IFNG, or 48 h before restimulation with PMA, ionomycin and brefeldin-A to determine the proportion of IFN-γ+ cells. (A) The transcript level of IFNG-AS1 was determined by qRT-PCR after transfection. (B) The transcript level of IFNG mRNA was determined by qRT-PCR after transfection. (C) The proportion of IFN-γ+ cells was analyzed by flow cytometric analysis. (D) The transcript level of IFNG-AS1 was detected by qRT-PCR after transfection after transfection with IFNG-AS1-specific siRNA in a dose-dependent manner. (E) The proportion of IFN-γ+ cells was analyzed by flow cytometric analysis after transfection with IFNG-AS1-specific siRNA in a dose-dependent manner. The results are indicated as the means ± SD of three independent experiments, horizontal lines show the mean. *p < 0.05; **p < 0.01; ***p < 0.001.

