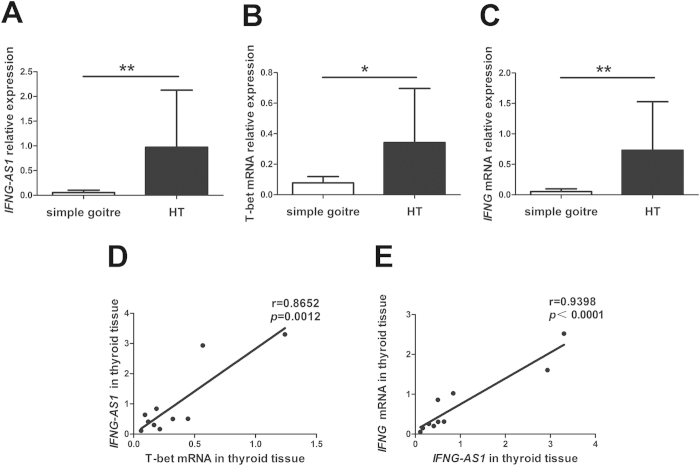
Figure 5. Upregulated expression of IFNG-AS1, T-bet and IFNG mRNA in thyroid tissues.
The transcript level of IFNG-AS1 (A), T-bet mRNA (B) and IFNG mRNA (C) in thyroid glands were determined by qRT-PCR from 10 patients with HT and 5 patients with simple goiter. Correlations between the transcript level of IFNG-AS1 and T-bet mRNA (D) or IFNG mRNA (E) in thyroid glands from 10 HT patients. Each data point represents an individual subject, horizontal lines show the mean. *p < 0.05; **p < 0.01.

