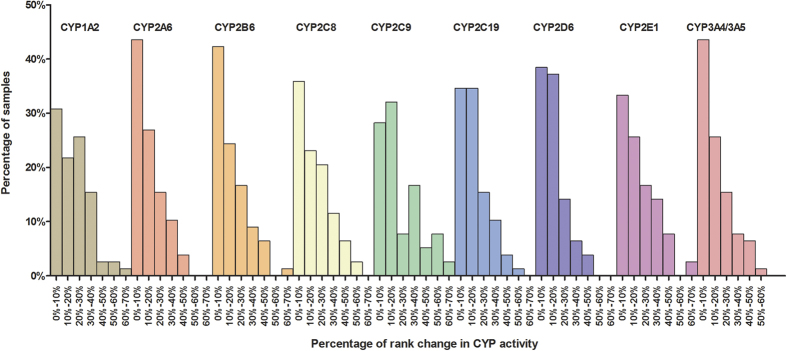
Figure 3. Percentage of rank change of individual VL compared with corresponding VM in 10 CYPs of 78 liver samples.
78 samples were ranked in ascending order according to the value of VM or VL for each CYP isoform, respectively. The rank change for each CYP isoform of each individual was the absolute difference value between the rank of VM and the rank of corresponding VL. The percentage of rank change was calculated by the total samples of 78 divided by rank change absolute value of each individual and every change of 10% as a group (such as 0%-10%, 10%-20%). The percentage of the samples in each group to total samples was also calculated. Rank change of less than 10% was considered as tiny change, between 10% and 20% as moderate change, between 20% and 50% as obvious change and exceeding 50% as dramatic change.

