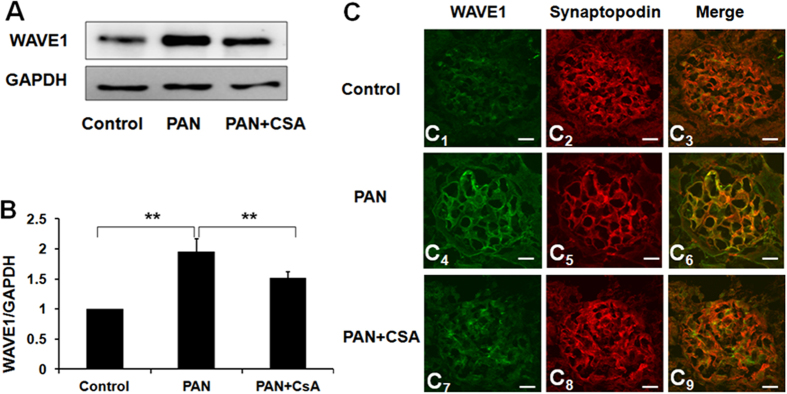
Figure 3. Effects of CsA on podocyte WAVE1 expression in PAN-induced rat nephropathy.
(A) Western blot analysis of WAVE1 in isolated glomeruli. (B) WAVE1 expression was quantified and normalized to GAPDH expression. (C) Immunofluorescent staining of WAVE1 and synaptopodin in rats. Scale bar = 20 μm. WAVE1 is labelled in green, and synaptopodin is labelled red. The data are presented as the mean ± SD. n = 5. **P < 0.01.

