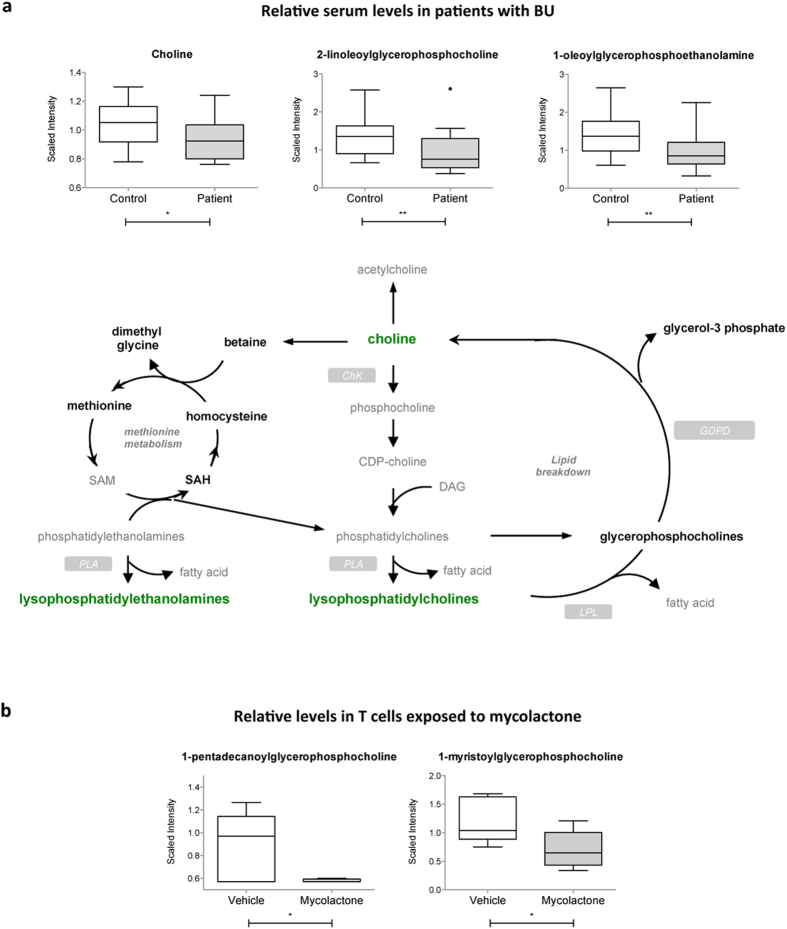
Figure 6. Decreased serum lysolipids in BU patients.
(a) Differential levels of choline and representative lysolipids in patients and controls, shown as box and whiskers and in the context of their metabolic pathway. Biochemicals in bold green were relatively decreased in patients versus controls. Those in bold black were detected at comparable levels. Those in grey were not detected. (b) Differential levels of the detected lysolipids in mycolactone- and vehicle-treated Jurkat T cells, presented as box and whiskers *p < 0.05, **p < 0.01.

