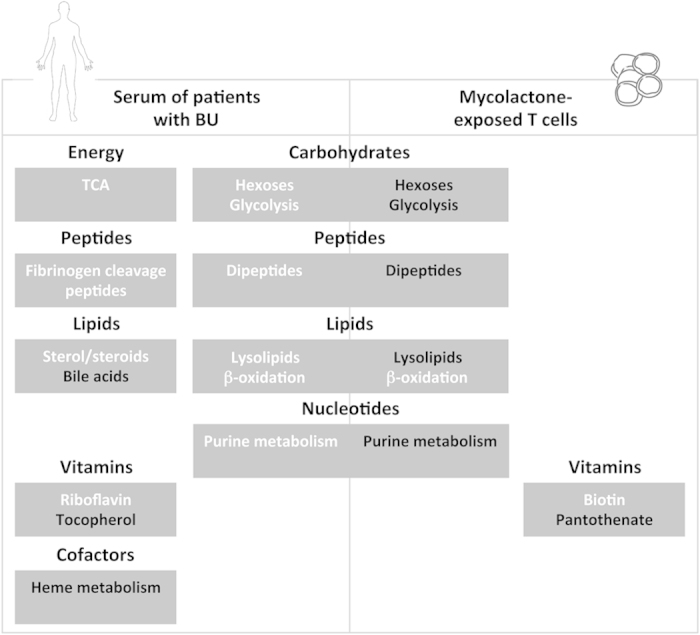
Figure 7. Metabolic alterations in patients with BU and mycolactone-exposed T cells partially overlap.

Metabolic alterations are grouped by biochemical pathway/biochemical structure, within boxes entitled with the corresponding metabolic pathway. In white: metabolites in this pathway were detected at higher levels in BU patients vs controls, or mycolactone-treated cells vs controls. In black: inversely.
