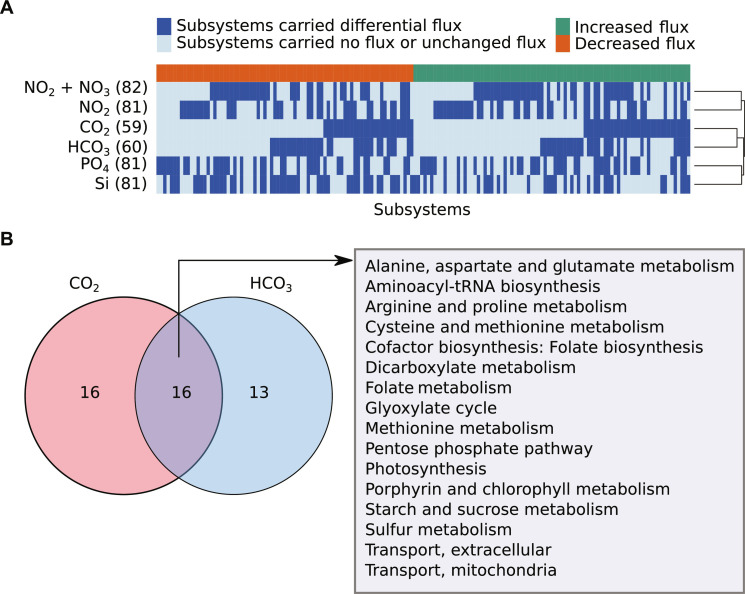
Fig. 4. Model predicted differential metabolic fluxes under elevated concentrations of nutrients.
(A) Heatmap represents differential flux-carrying subsystems under elevated CO2, HCO3, NO2, NO2 + NO3, PO4, and Si conditions. It shows subsystems separately with increased and decreased fluxes due to change in nutrient uptake fluxes from low to high levels. The numbers in parentheses denote the number of differential flux-carrying subsystems for each nutrient. The details of altered subsystems under varying growth conditions can be seen in table S19. We compared the metabolic flux distributions through the network when the model was simulated using the low and high concentrations of nutrients. Low and high uptake fluxes of nutrients to the model were used to mimic the low and high concentrations that were obtained from metadata of Tara Oceans global ocean microbiome data (table S11). The low and high concentrations of nutrients were defined by comparing with average concentration values for each nutrient (see Materials and Methods). (B) This Venn diagram represents shared and unique subsystems of C. closterium with increased flux distributions under the elevated concentration of CO2 and HCO3. The shared and unique subsystems in other pairs of conditions can be seen in figs. S5 to S7 and tables S17 and S18.

