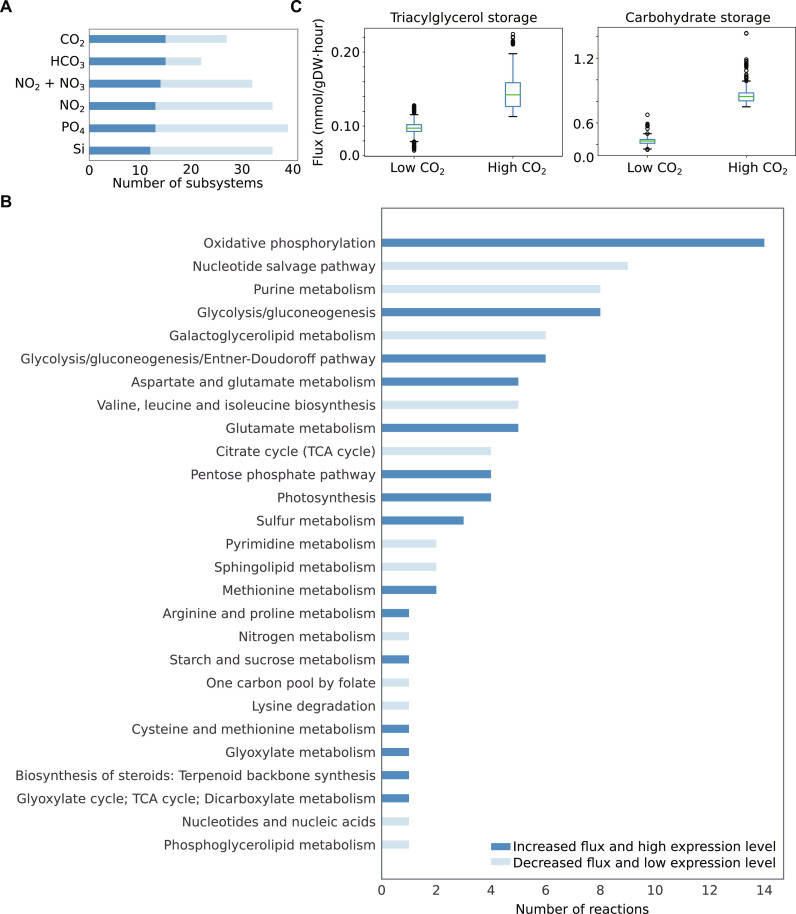
Fig. 5. Intersection between differential model–predicted fluxes and gene expressions.
(A) Bar plot represents subsystems that carry differential (increased or decreased) fluxes and are associated with differentially expressed genes under elevated concentrations of nutrients, such as CO2, HCO3, NO2, NO2 + NO3, PO4, and Si. (B) As an example, under elevated CO2, 27 subsystems illustrated differential metabolic fluxes and differentially expressed genes. This bar plot represents the number of reactions involved in these subsystems. Affected subsystems under additional conditions are shown in figs. S9 to S13. (C) Model-predicted storage of TAG and carbohydrate in terms of accumulation fluxes of TAG and β-1,3 glucans (i.e., monomers of chrysolaminarin), respectively, under low and high CO2. Each box plot denotes all allowable possible fluxes that were estimated using a sampling method (31) while simulating the model (see Materials and Methods). Significance (P value <0.001) was computed using two-side Student’s t test.

