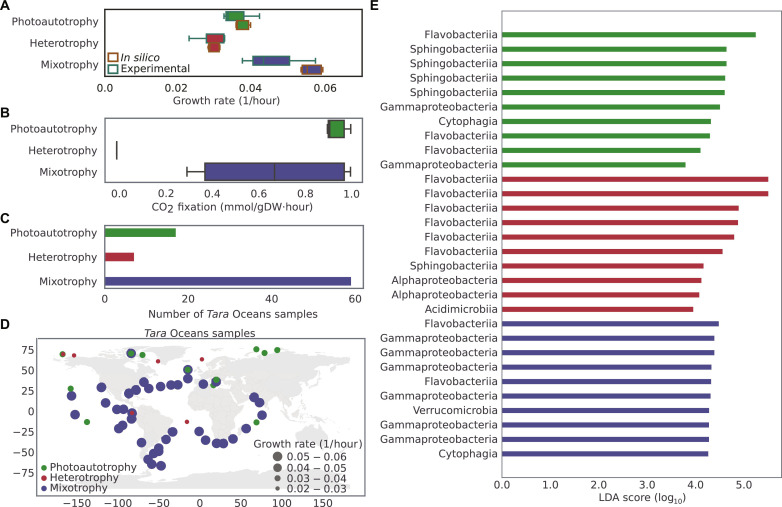
Fig. 6. Trophic modes of C. closterium in marine environments.
(A) Predicted and experimental growth rate of C. closterium under photoautotrophic, heterotrophic, and mixotrophic conditions. Extracellular succinate was used as an organic carbon source to stimulate growth under heterotrophic and mixotrophic conditions. Box plots represent all feasible biomass flux values that were determined by simulating iMK1961 using a uniform random sampling method (31) (see Materials and Methods) and experimentally measured growth rates. To simulate growth under trophic conditions, the model was constrained using experimentally measured uptake fluxes table S9. (B) CO2 fixation in C. closterium during photoautotrophy, heterotrophy, and mixotrophy. CO2 fixation was represented in terms of the uptake flux of CO2 while simulating the growth in different conditions. (C) The predicted flux distributions and metatranscriptomics data helped to identify trophic modes of C. closterium in the Tara Oceans samples. Bar plots represent the number of samples where solely photoautotrophic, heterotrophic, or mixotrophic growth of C. closterium was detected. Unique sets of active reactions, which overlapped with expressed genes in transcriptomics data for each trophic mode, were used to categorize samples in three different modes (table S21 and figs. S14 to S16). (D) The global distribution of various trophic modes of C. closterium was identified using iMK1961 and metatranscriptomics data from Tara Oceans samples. Dot size represents the predicted growth rate of C. closterium under the corresponding trophic condition. (E) To identify significantly differentially abundant marine prokaryotes between different trophic modes, linear discriminant analysis (LDA) effect size (79) was deployed on Tara Oceans metagenomic data. Bar plot represents 10 most differentially abundant prokaryotes in each trophic mode [P value <0.05 (Kruskal-Wallis test and pairwise Wilcoxon test); LDA score (log10) > 2.0] (see Materials and Methods). A complete list of differentially abundant prokaryotes can be seen in table S26.

