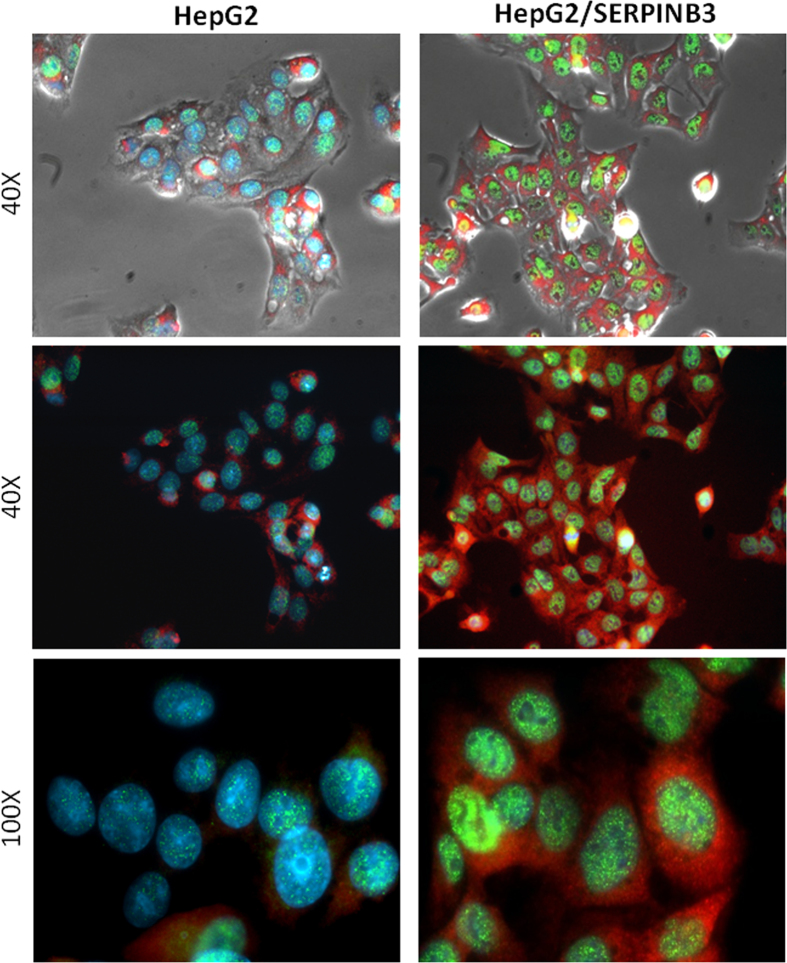
Figure 2. Immunoflorescence results.
Merge of contrast phase (first row) and indirect immunofluorescence (second and third row) analysis for SerpinB3 (red, Cy3) and Myc (green, 488) performed in control HepG2 and in HepG2 cells overexpressing SerpinB3 (HepG2/SERPINB3). Nuclei are stained in blue (dapi). Original magnification are reported. Evaluation of immunoflorescence was assessed in three independent experiments examining at least ten random high-power fields.

