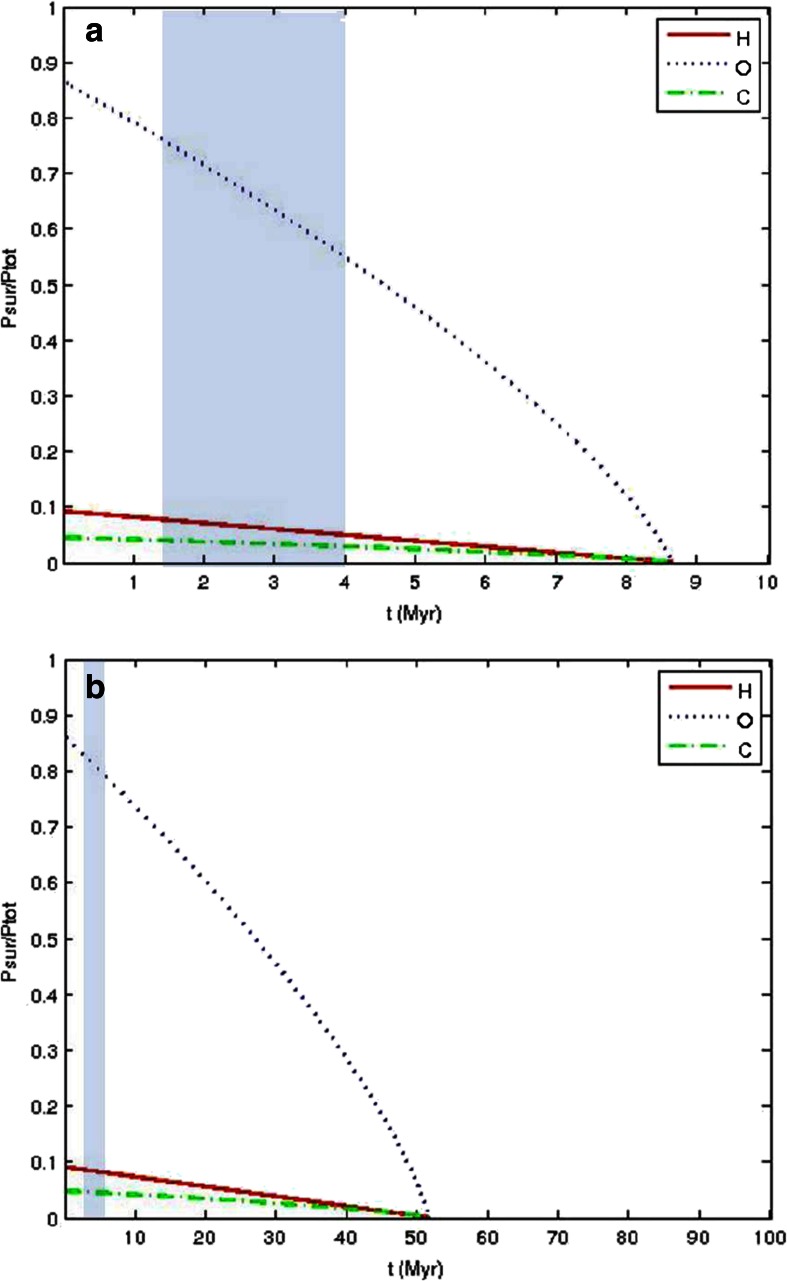
Fig. 2.
Temporal evolution of the partial surface pressures P surf of H, O and C normalized to the total initial surface pressure P total for the expected outgassed volatile amounts shown in Table 2. Panels a) and b) correspond to the expected minimum and maximum outgassing scenarios for the exomoon with 0.5 M ⊕ and 0.8R ⊕. The blue shaded area marks the range of water condensation onsets as modeled by Lebrun et al. (2013) (lower value: ~1 Myr) and Hamano et al. (2013) (higher value: ~4 Myr)

