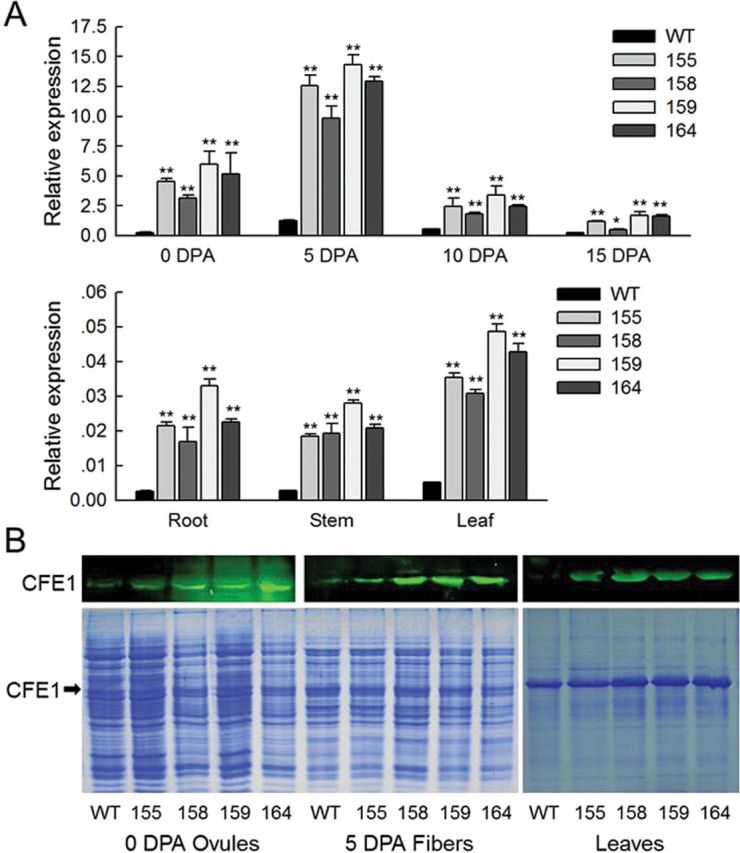
Fig. 4.

The transcript and protein level analysis of GhCFE1 in wild type (WT) and GhCFE1A-overexpressing cotton. (A) qRT-PCR analysis of expression levels of GhCFE1 in 0 DPA ovules, 5–15 DPA fibres, roots, stems, and leaves of WT and 35S-sense-GhCFE1A (35SSC) transgenic (lines 155, 158, 159, and 164) plants. Error bars represent the standard deviation of triplicate experiments, and His3 was used as an internal control (*P<0.05, **P<0.01, by Student’s t-test). (B) Western blotting with antibodies against GhCFE1 reveals increased abundance of GhCFE1 in 0 DPA ovules, 5 DPA fibres, and leaves of 35SSC transgenic lines (155, 158, 159, and 164). The size of the GhCFE1 band was determined by heterologous expression of GhCFE1A in E. coli (Supplementary Fig. S4 at JXB online), and is indicated by the black arrows. (This figure is available in colour at JXB online.)
