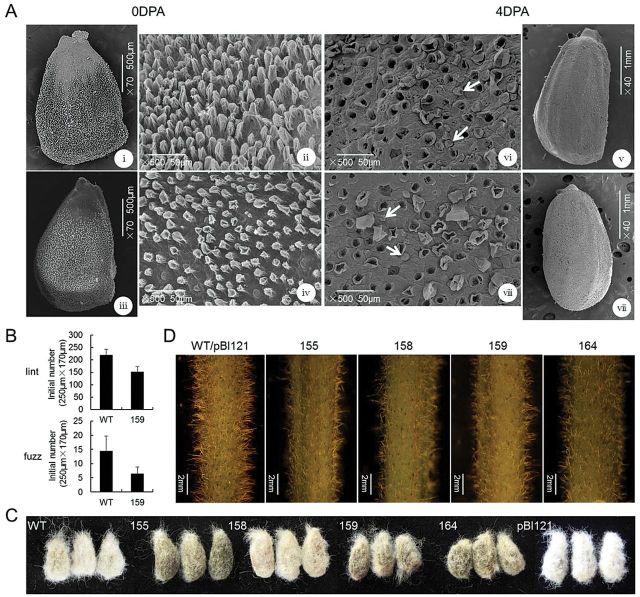
Fig. 5.
Characterization and phenotype analysis of cotton seed and stem trichome initials. (A) Scanning electron microscope (SEM) images of (i–iv) 0 DPA ovules and (v–viii) 4 DPA seeds, with the lint fibre removed to make the fuzz fibre visible, illustrate the morphological differences of lint and fuzz fibre initials between the wild type (WT; i and ii; v and vi) and 35SSC line 159 (iii and iv; vii and viii). The SEM images were taken at a similar position in the middle of the ovules and seeds. White arrows indicate fuzz fibre cells (vi and viii). (B) Lint and fuzz fibre initials were counted from SEM images of ovules and seeds obtained at 0 and 4 DPA, respectively. The values were averaged over 20 images of 10 selected ovules over an area of 250 μm×170 μm for each line and the wild-type cotton. (C) Photographs of seeds from 35SSC lines, the wild type, and control (pBI121) plants with the mature lint fibres detached. (D) The stem trichomes in 35SSC transgenic cotton lines (155, 158, 159, and 164) have lower density than those in the wild-type cotton.

