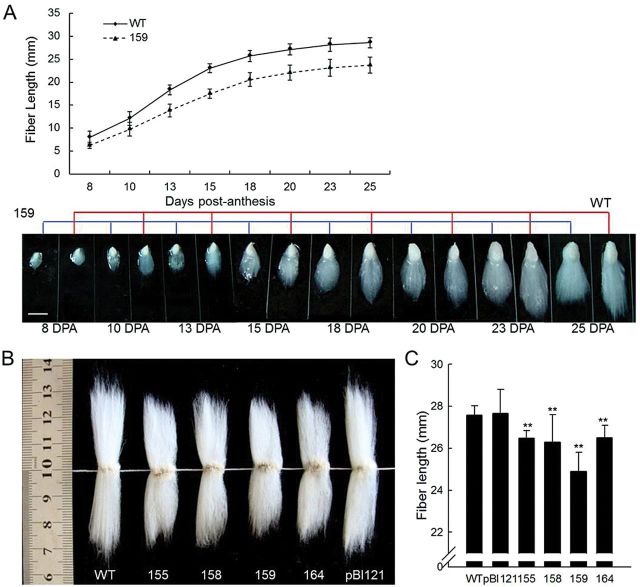
Fig. 6.
Retardation of the fibre elongation process in the GhCFE1A-overexpressing cotton lines. (A) Dynamic curve of fibre development and phenotypes of fibre-bearing seeds in the wild type (WT) and transgenic line 159. Fibre length was quantified and the values were averaged over 10 fibre-bearing ovules of each of the three selected individual plants at every stage for the transgenic line (159) and the wild-type cotton. The stages are indicated at the bottom of the graphs. Scale bar=10mm. (B) The mature lint fibres from 35SSC transgenic cotton lines (155, 158, 159, and 164) were shorter than those from the null control (pBI121) or wild-type fibres, particularly line 159. (C) Average fibre length of the null control, WT, and 35SSC transgenic (lines 155, 158, 159, and 164) fibres. Error bars indicate the standard deviation of triplicate experiments (**P<0.01, by Student’s t-test). (This figure is available in colour at JXB online.)

