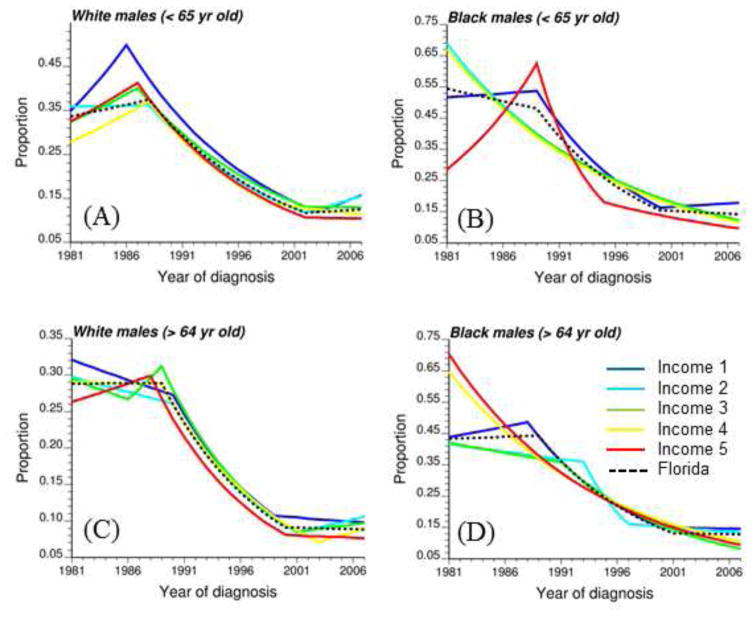
Fig. 6.
Joinpoint regression models fitted to time series of proportion of late-stage diagnosis computed for two age categories ([40–64], [65,120]), two race groups (white and black males), and five classes of increasing median household income (Income 1 → Income 5). The black dashed curve corresponds to the state wide trend model.

