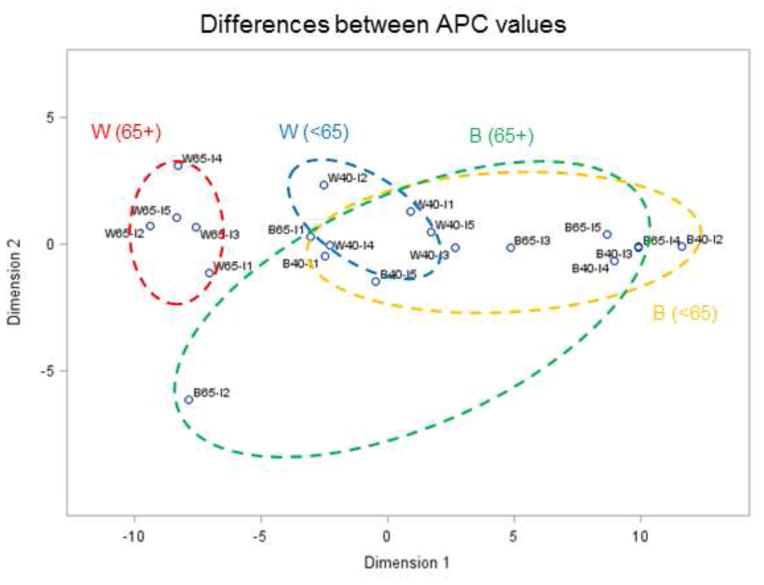
Fig. 8.
Results of multi-dimensional scaling applied to annual proportion of late-stage prostate cancer in Florida between 1981 and 2007. The 20 time series (2 races × 2 age groups × 5 income levels) were projected in a 2D space based on their dissimilarity quantified using an APC-based distance metric: time series close to each other in 2D share similar temporal trends; the first letter denotes race (W,B), then age category (40–64, 65+), then income level (I1 – I5). Ellipses are drawn for visualization and have no statistical meaning.

