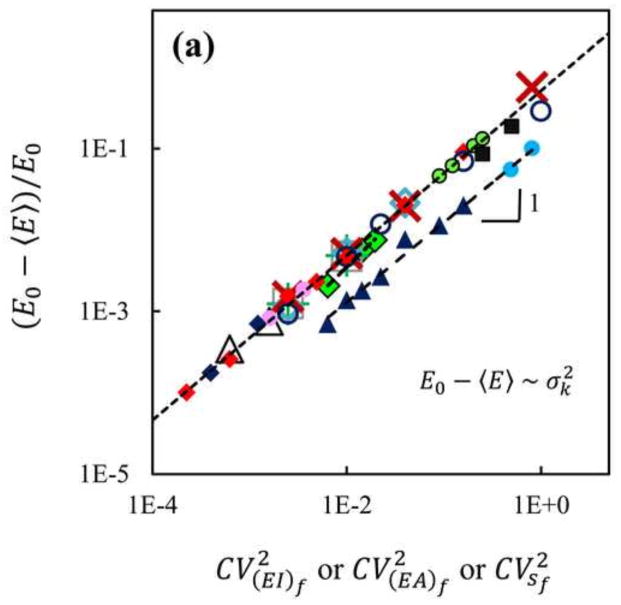
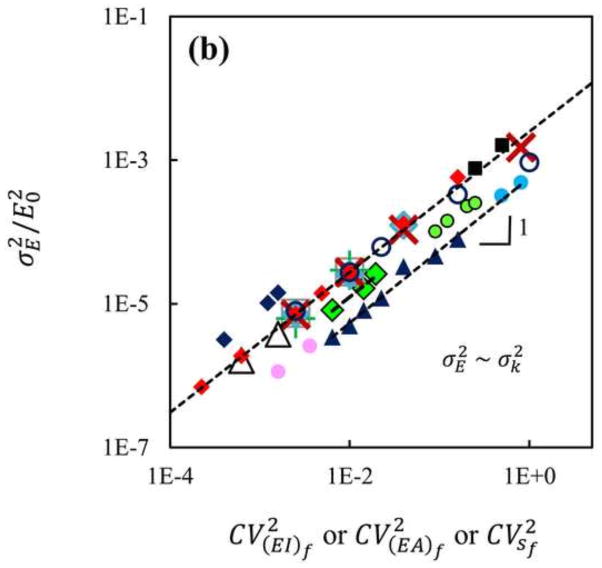
Fig. 4.
(a) The normalized softening and (b) normalized variance of the overall network stiffness against the coefficient of variation of the stiffness of the constituent fibers. For each data set, both these quantities scale linearly with the variance of the fiber stiffness. The variable on the horizontal axis is the coefficient of variation of the distribution of either (EA)f, (EI)f or sf as appropriate for the respective test. The various symbols used here are described in Table 1 or in the text. Each point in this plot was obtained by averaging over five hundred replicas. k in the scaling laws denotes the fiber stiffness in a single mode, either (EA)f, (EI)f or sf. The values shown by the vertical axes are normalized by the small-strain stiffness of the respective homogeneous network stiffness, E0, for each data series.


